Market Week: October 25, 2021

Single-Family Housing Flat in September as Lumber Rises Again

Single-family housing production remained steady in September as strong demand helped offset rising building material prices exacerbated by supply chain disruptions, especially with lumber. On Tuesday, the U.S. Department of Housing and Urban Development and the U.S. Census Bureau reported the following:

Building Permits

  • Privately‐owned housing units authorized by building permits in September were at a seasonally adjusted annual rate of 1,589,000.
  • This is 7.7% below the revised August rate of 1,721,000, but is virtually unchanged from the September 2020 rate.
  • Single‐family authorizations in September were at a rate of 1,041,000
  • This is 0.9% below the revised August figure
  • Authorizations of units in buildings with five units or more were at a rate of 498,000 in September.

Housing Starts

  • Privately‐owned housing starts in September were at a seasonally adjusted annual rate of 1,555,000.
  • This is 1.6% below the revised August estimate, but is 7.4% above the September 2020 rate.
  • Single‐family housing starts in September were at a rate of 1,080,000; this is virtually unchanged from the revised August figure.
  • The September rate for units in buildings with five units or more was 467,000.

Housing Completions

  • Privately‐owned housing completions in September were at a seasonally adjusted annual rate of 1,240,000.
  • This is 4.6% below the revised August estimate and is 13.0% below the September 2020 rate.

Single‐family housing completions in September were at a rate of 953,000; this is virtually unchanged from the revised August rate. The September rate for units in buildings with five units or more was 280,000.

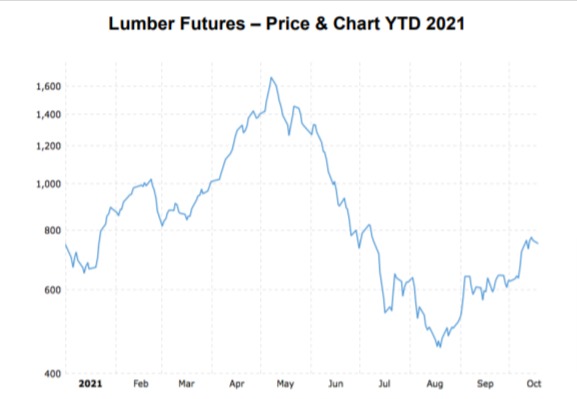
Lumber Prices Climbing Again

According to the National Association of Home Builders: “Single-family construction continued along recent, more sustainable trends in September. Lumber prices have moved off recent lows, but the cost and availability of many building materials continues to be a challenge for a market that still lacks inventory. Policymakers should continue to work to improve supply-chains.”

“Builder confidence increased in October, which confirms stabilization of home construction at current levels. The number of single-family units in the construction pipeline is 712,000, almost 31% higher than a year ago as more inventory is headed to market.”

More Data Later in the Week

More economic data will be released later this week, including the Beige Book on Wednesday; Leading Indicators and the Philadelphia Fed Manufacturing Index on Thursday.

Click here to download a PDF of this report.

Securities offered through LPL Financial, Member FINRA/SIPC. E2E Financial is another business name of Independent Advisor Alliance, LLC. All investment advice is offered through Independent Advisor Alliance LLC, a registered investment advisor. Independent Advisor Alliance is a separate entity from LPL Financial.

The information contained in this e-mail message is being transmitted to and is intended for the use of only the individual(s) to whom it is addressed. If the reader of this message is not the intended recipient, you are hereby advised that any dissemination, distribution or copying of this message is strictly prohibited. If you have received this message in error, please immediately delete.

This information is not intended to be a substitute for specific individualized tax or legal advice. We suggest that you discuss your specific situation with a qualified tax or legal advisor.

This material is for general information only and is not intended to provide specific advice or recommendations for any individual. Investing involves risk including the possible loss of principal.

The S&P 500 is a stock market index tracking the stock performance of 500 of the largest companies listed on stock exchanges in the United States. Indexes are unmanaged and cannot be invested in directly.

The Standard & Poor’s 500 Index (S&P500) is a capitalization-weighted index of 500 stocks designed to measure performance of the broad domestic economy through changes in the aggregate market value of 500 stocks representing all major industries.
The Bloomberg U.S. Aggregate Index represents the U.S. investment-grade fixed-rate bond market. This index is unmanaged, and its results include reinvested dividends and/or distributions but do not reflect the effect of sales charges, commissions, account fees, expenses or U.S. federal income taxes.

Bonds are subject to market and interest rate risk if sold prior to maturity. Bond values will decline as interest rates rise and bonds are subject to availability and change in price.

This material is for general information only and is not intended to provide specific advice or recommendations for any individual. There is no assurance that the views or strategies discussed are suitable for all investors or will yield positive outcomes. Investing involves risks including possible loss of principal. Any economic forecasts set forth may not develop as predicted and are subject to change.

There is no guarantee that a diversified portfolio will enhance overall returns or outperform a non-diversified portfolio. Diversification does not protect against market risk.

Market Index captures broad US equity coverage. The index includes 3,204 constituents across large, mid, small and micro capitalizations, about 99% of the US equity universe. Indexes are unmanaged and cannot be invested in directly.
International investing involves special risks such as currency fluctuation and political instability and may not be suitable for all investors. These risks are often heightened for investments in emerging markets.

Don’t miss the next one. Subscribe for early access.

ARE YOU READY TO TAKE YOUR PRACTICE TO THE NEXT LEVEL?