Market Week: November 8, 2021

Homeownership Rate Drops From 2020, Consumers Sentiment Stays As-Is and Construction Spending Falls

On November 2nd, the U.S. Census Bureau announced the following residential vacancies and homeownership statistics for the third quarter 2021:

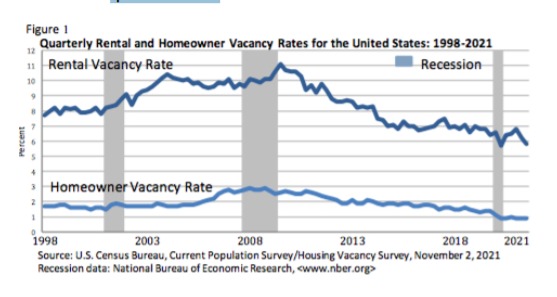
  • National vacancy rates in the third quarter 2021 were 5.8% for rental housing and 0.9% for homeowner housing
  • The rental vacancy rate was 0.6% lower than the rate in the third quarter 2020 and 0.4% lower than the rate in the second quarter 2021
  • The homeowner vacancy rate of 0.86% was lower than the rate in the third quarter 2020 and virtually the same as the rate in the second quarter 2021
  • The homeownership rate of 65.4% was 2.0% lower than the rate in the third quarter 2020 and virtually the same as the rate in the second quarter 2021

Consumer Sentiment Unchanged

According to the University of Michigan’s Consumer Survey Center, consumer sentiment remained virtually unchanged, gaining just 0.3 index points, and just 0.1 index points above the average in the past two months, and only 0.1 index points below the April 2020 low.

“The positive impact of higher income expectations and the receding coronavirus has been offset by higher rates of inflation and falling confidence in government economic policies. Consumers not only anticipated the highest year-ahead inflation rate since 2008 in the October survey, consumers also expressed greater uncertainty about the year-ahead inflation rate than any time in nearly 40 years.”

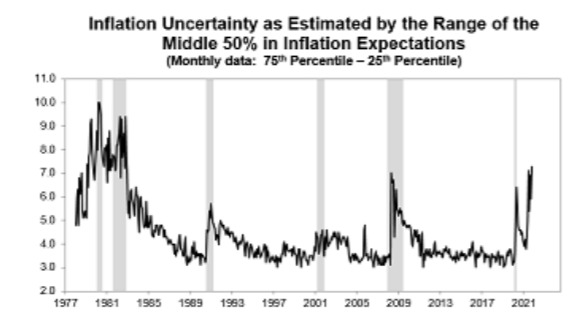
“Note that this was the first major spike in inflation uncertainty recorded outside of a recession. Even uncertainty about the long-term inflation rate was the highest in more than a decade. Declining living standards due to inflation were spontaneously mentioned by one-ofevery five households, concentrated among older and poorer households.”

Construction Spending Falls From August

On November 1st, the U.S. Census Bureau announced the following construction statistics for September 2021:

Total Construction

  • Construction spending during September 2021 was at an annual rate of $1,573.6 billion
  • This is 0.5% below August and 7.8% above September 2020
  • During the first nine months of this year, construction spending amounted to $1,177.5 billion, 7.1% above the $1,099.8 billion for the same period in 2020

More Data Later in the Week

More economic data will be released later this week, including the ADP Employment Report on Wednesday and Consumer Credit data on Friday.

Click here to download a PDF of this report.

Securities offered through LPL Financial, Member FINRA/SIPC. E2E Financial is another business name of Independent Advisor Alliance, LLC. All investment advice is offered through Independent Advisor Alliance LLC, a registered investment advisor. Independent Advisor Alliance is a separate entity from LPL Financial.

The information contained in this e-mail message is being transmitted to and is intended for the use of only the individual(s) to whom it is addressed. If the reader of this message is not the intended recipient, you are hereby advised that any dissemination, distribution or copying of this message is strictly prohibited. If you have received this message in error, please immediately delete.

This information is not intended to be a substitute for specific individualized tax or legal advice. We suggest that you discuss your specific situation with a qualified tax or legal advisor.

This material is for general information only and is not intended to provide specific advice or recommendations for any individual. Investing involves risk including the possible loss of principal.

The S&P 500 is a stock market index tracking the stock performance of 500 of the largest companies listed on stock exchanges in the United States. Indexes are unmanaged and cannot be invested in directly.

The Standard & Poor’s 500 Index (S&P500) is a capitalization-weighted index of 500 stocks designed to measure performance of the broad domestic economy through changes in the aggregate market value of 500 stocks representing all major industries.
The Bloomberg U.S. Aggregate Index represents the U.S. investment-grade fixed-rate bond market. This index is unmanaged, and its results include reinvested dividends and/or distributions but do not reflect the effect of sales charges, commissions, account fees, expenses or U.S. federal income taxes.

Bonds are subject to market and interest rate risk if sold prior to maturity. Bond values will decline as interest rates rise and bonds are subject to availability and change in price.

This material is for general information only and is not intended to provide specific advice or recommendations for any individual. There is no assurance that the views or strategies discussed are suitable for all investors or will yield positive outcomes. Investing involves risks including possible loss of principal. Any economic forecasts set forth may not develop as predicted and are subject to change.

There is no guarantee that a diversified portfolio will enhance overall returns or outperform a non-diversified portfolio. Diversification does not protect against market risk.

Market Index captures broad US equity coverage. The index includes 3,204 constituents across large, mid, small and micro capitalizations, about 99% of the US equity universe. Indexes are unmanaged and cannot be invested in directly.
International investing involves special risks such as currency fluctuation and political instability and may not be suitable for all investors. These risks are often heightened for investments in emerging markets.

Don’t miss the next one. Subscribe for early access.

ARE YOU READY TO TAKE YOUR PRACTICE TO THE NEXT LEVEL?