MARKETS REBOUND AS SIGNS OF MODERATING INFLATION APPEAR AND WASHINGTON UNVEILS A BIPARTISAN INFRASTRUCTURE AGREEMENT
- All of the major U.S. equity indices came roaring back this week, rising more than they lost last week, as NASDAQ crested a new record high
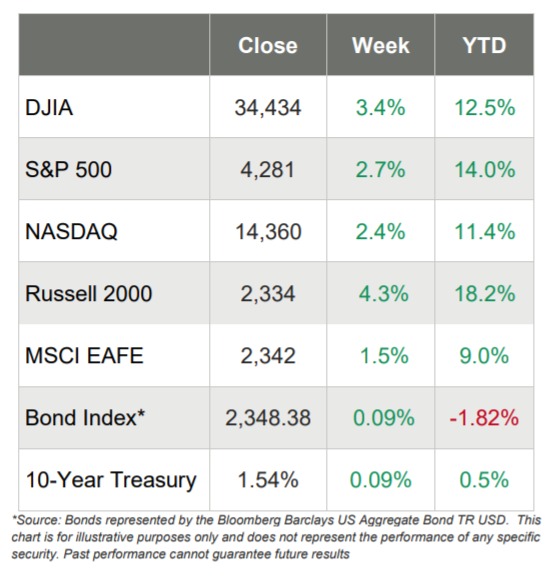
- All four indices were up more than 2%, with the small-cap Russell 2000 leading the way with a gain of 4.3%, followed by the DJIA’s jump of 3.4%, the S&P 500’s 2.7% rise and NASDAQ’s 2.4% climb
- Every single one of the 11 S&P 500 sectors advanced this week, led by the Energy (+6.7%) and Financials (+5.3%) sectors as the Utilities sector (+0.7%) brought up the rear
- While Wall Street was skittish last week after certain remarks from the Fed, this week brought soothing comments from Fed Chair Jerome Powell when he said the Fed wouldn’t raise rates too soon because of inflation fears while also remarking that he thought job growth would be good this fall
- Washington announced a bipartisan $1.2 trillion infrastructure agreement on Thursday
- In economic news, Wall Street ignored less-thanstellar new homes data for May and the fact that core-PCE Price Index for May rose 0.5% over the past month, putting it on a year-over-year pace of 3.4%
- WTC Crude Oil rose more than $3/barrel and ended the week at more than $74/barrel, its highest level since the fall of 2018
- The 10-year Treasury yield rose nine basis points to 1.54% while the 2-year Treasury yield increased one basis point to 0.27%
Every Action Has an Equal and Opposite Reaction?
Formally stated, Newton’s third law is: for every action, there is an equal and opposite reaction. And that’s what this week’s market movements felt like on the heels of last week’s decline.
- This week, the small-cap Russell 2000 led the way with a gain of 4.3% whereas last week it lost 4.2%
- This week the DJIA jumped 3.4% whereas last week it lost 3.4%
- This week the S&P 500 climbed 3.4%, whereas last week it lost 1.9%
- This week NASDAQ was up 2.4%, whereas last week it lost 0.3%
Well, maybe the S&P 500 and NASDAQ were not quite in line with Newton’s third law, but that could be because both indices were too busy marching to new highs and recording their best weekly gains since early April.
U.S. stock indices generally marched higher all week, amidst relatively low summer-like trading volume. The Energy sector was the big winner with a gain of more than 6%, helped along by the price of oil reaching its highest point since October 2018.
The Federal Reserve was in the news again this week, this time saying that the Fed wouldn’t not raise rates prematurely due to inflation. And as if on cue, data that suggests inflation might be moderating was released, including the fact that commodity prices were declining, especially lumber prices.
In addition, Bloomberg reported that retail vehicle prices might soon drop, which is an important data set as the almost 30% year-over-year jump in used car prices accounted for about 1/3 of recent inflation numbers. And earlier in the week, investors received word that new home sales were softer than expected in May, dropping almost 6%.
Private-Sector Activity is Expanding
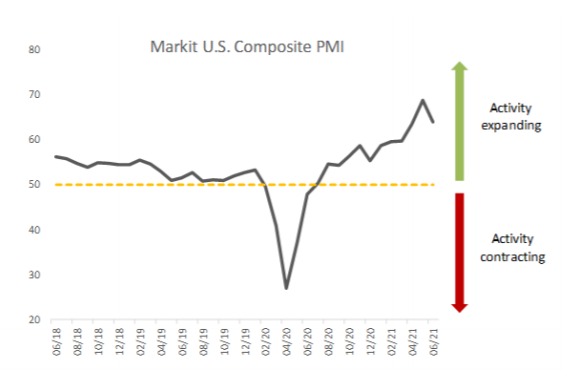
The June preliminary Purchasing Managers’ Index, a leading indicator of economic activity, showed that output across the private sector expanded at a historically elevated rate. From the release:
“U.S. private sector businesses registered a further marked expansion in activity during June, as further easings of COVID-19 restrictions boosted new orders. The rate of expansion softened slightly from the high seen in May, but remained substantial overall.
Adjusted for seasonal factors, the IHS Markit Flash U.S. Composite PMI Output Index posted 63.9 in June, down from 68.7 in May, but nonetheless signaling a historically elevated rate of expansion in output across the private sector. Moderations in activity growth were seen in both the manufacturing and service sectors, with goods producers hampered in particular by significant supplier delays and both sectors reporting difficulties finding staff.”
New Home Sales Dip in May
On Tuesday, the National Association of Realtors announced that existing-home sales decreased for a fourth straight month in May. Further, only one major U.S. region recorded a month-over-month increase, while the other three regions saw sales decline. However, each of the four areas again registered double-digit year-over-year gains, which is not surprising given the state of the real estate market and the economy in general this time last year.
According to the release from the NAR, total existing-home sales – completed transactions that include single-family homes, townhomes, condominiums and co-ops – dropped 0.9% from April to an annual rate of 5.80 million in May. But sales in total were up a stunning 44.6% from just one year ago (May 2020).
The NAR further reported that:
- The median existing-home price for all housing types in May was $350,300, up 23.6% from May 2020 ($283,500), as every region registered price increases.
- This is a record high and marks 111 straight months of year-over-year gains since March 2012.
- Total housing inventory at the end of May amounted to 1.23 million units, up 7.0% from April’s inventory and down 20.6% from one year ago (1.55 million).
- Unsold inventory sits at a 2.5-month supply at the present sales pace, marginally up from April’s 2.4- month supply but down from 4.6-months in May 2020.
- Properties typically remained on the market for 17 days in May, unchanged from April and down from 26 days in May 2020.
- Eighty-nine percent of the homes sold in May 2021 were on the market for less than a month.
Vacation Home Sales Jump
A new study released by NAR last week found that from January to April 2021, the share of vacation home sales to total existing-home sales rose to 6.7%. Vacation home sales jumped 57.2% year-over-year compared to the 20% yearover-year growth in total existing-home sales.
Elsewhere Around the World
- The pan-European STOXX Europe 600 Index ended the week 1.23% higher
- Germany’s Xetra DAX Index rose 1.04%
- France’s CAC 40 moved up 0.82%
- Italy’s FTSE MIB advanced 1.16%
- The UK’s FTSE 100 Index added 1.69%
- Japan’s Nikkei 225 Index rose 0.35% and its TOPIX was up 0.83%
- China’s CSI-300 Index jumped 2.7% and its Shanghai Composite Index rose 2.3%


