Current Account Deficit Widens by $16.5 Billion, Up 8.3% from 2Q
The current account measures the United States’ international trade balance in goods, services, and unilateral transfers and is reported by the U.S. Bureau of Economic Analysis on a quarterly basis.
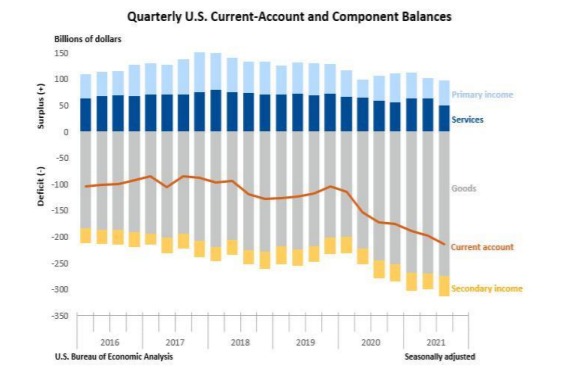
On Tuesday, the BEA reported that the U.S. current account deficit widened by $16.5 billion – that’s 8.3% – to $214.8 billion in the third quarter of 2021.
For comparison the second-quarter deficit was $198.3 billion.
Further, the third-quarter deficit was 3.7% of current dollar gross domestic product, up from 3.5% in the second quarter.
From the BEA: “The $16.5 billion widening of the current-account deficit in the third quarter reflected a reduced surplus on services and expanded deficits on secondary income and on goods that were partly offset by an expanded surplus on primary income.”
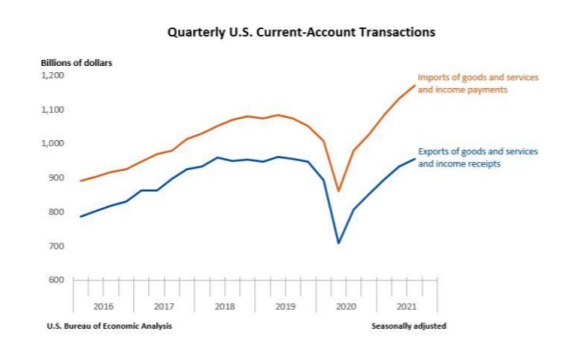
“Exports of goods and services to, and income received from, foreign residents increased $22.8 billion to $955.9 billion in the third quarter. Imports of goods and services from, and income paid to, foreign residents increased $39.3 billion to $1.17 trillion.
Trade in Goods
“Exports of goods increased $4.8 billion to $441.6 billion, mainly reflecting increases in industrial supplies and materials, mostly natural gas and petroleum and products, and in consumer goods, mostly medicinal, dental, and pharmaceutical products. A decrease in foods, feeds, and beverages, mostly corn and soybeans, partly offset these increases. Imports of goods increased $10.0 billion to $716.4 billion, primarily reflecting an increase in industrial supplies and materials, mostly petroleum and products and chemicals.”
Trade in Services
“Exports of services decreased $0.1 billion to $190.8 billion, primarily reflecting decreases in charges for the use of intellectual property, mostly licenses for the use of outcomes of research and development (such as patents and trade secrets), and in telecommunications, computer,
and information services, mostly computer services. An increase in other business services, mostly professional and management consulting services, partly offset these decreases. Imports of services increased $12.6 billion to $141.0 billion, mostly reflecting increases in travel, primarily other personal travel, and in transport, primarily sea freight and air passenger transport.”
More Data Later This Week
More economic data will be released later this week, including GDP and Consumer Confidence on Wednesday and Jobless Claims and New Home Sales on Thursday.
Click here to download a PDF of this report.
Weekly Market Recap
The week in review
- Consumer confidence rose to 115.8 in Dec. from 111.9 in Nov.
The week ahead
- S&P/Case-Shiller HPI
Thought of the week
Last week, Democratic Senator Manchin disavowed support for the $2T Build Back Better Act, which had already been teetering on a very thin Democratic majority. Manchin seems amenable to a $1.8T bill, but with some meaningful revisions, leaving a sliver of hope for a slimmed down deal in 2022.
However, if a bill does not pass, the enhanced child tax credit (CTC) will expire at year-end. The American Rescue Plan, enacted in March 2021, brought three important changes to the CTC: increased benefit levels (annual payments up to $3,600/child from $2,000), expanded access to the lowest income families and advanced monthly installments. This was a boon to lower income families who have a higher propensity to spend.
According to the U.S. Census Bureau’s Household Pulse Survey, 91% of families with an annual income of <$35,000 used their CTC for basic household expenses with 59% using a portion of their benefit on
food. As illustrated in the chart, lower income Americans spend disproportionally more of their after-tax annual income on food. Their spending behavior is much more sensitive to external forces, whether that be positively through the enhanced CTC or negatively through higher inflation. As we enter 2022, we are in an environment where the enhanced CTC is set to expire and food inflation is up 6.1% y/y,
two factors that may constrain spending for lower income Americans in the short-term. These factors may potentially cause a temporary dent in their consumption which
could be a headwind for economic growth next year.


