Market Returns After Midterm Elections Have Been Strong

In a year when soaring inflation, the war in Ukraine and a bear market have commanded headlines, the U.S. midterm elections risked becoming an afterthought. But now the election is coming back into focus. And with good reason. Capital Group political economist Matt Miller believes 2022 could be one of the more consequential midterm elections in U.S. history.

But while control of Congress may be at stake, do midterm elections have any effect on equity markets?

Midterm elections occur at the midpoint of a presidential term and usually result in the president’s party losing ground in Congress. Over the past 22 midterm elections, the president’s party has lost an average 28 seats in the House of Representatives and four in the Senate. Only twice has the president’s party gained seats in both chambers.

It may come as no surprise then that market volatility is higher in midterm election years, especially in the weeks leading up to Election Day. Since 1970, midterm years have a median standard deviation (a measurement of volatility) of returns of nearly 16%, compared with 13% in all other years.

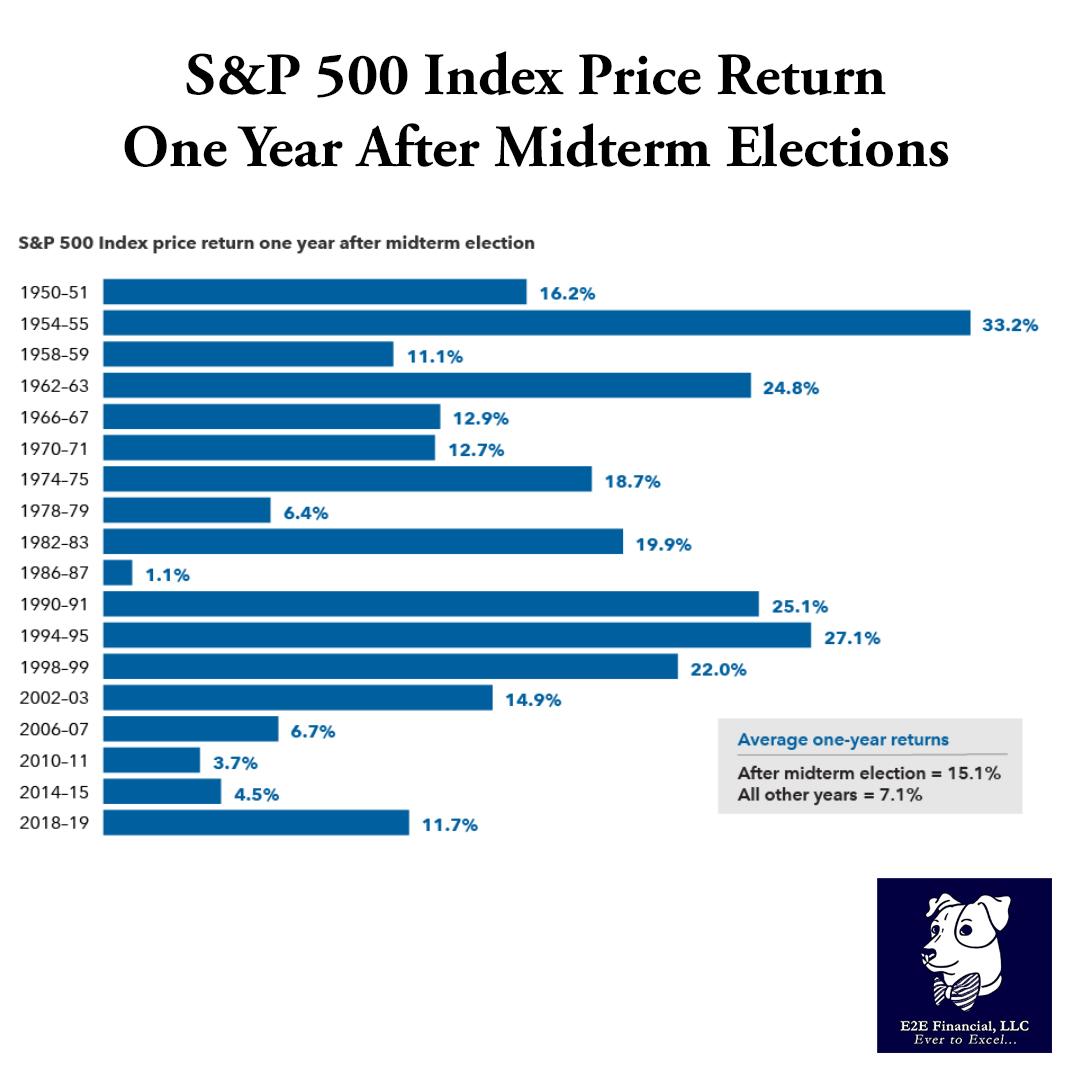
The silver lining for investors is that markets have tended to rebound strongly in subsequent months, and the rally that has often started shortly before Election Day hasn’t been just a short-term blip. Above-average returns have been typical for the full year following the election cycle. Since 1950, the average one-year return following a midterm election was 15%. That’s more than twice the return of all other years during a similar period. (see the chart)

Of course every cycle is different, and elections are just one of many factors influencing market returns. For example, over the next year investors will need to weigh the impacts of a potential U.S. recession and global economic and geopolitical concerns.

What’s the bottom line for investors?

Midterm elections — and politics as a whole — generate a lot of noise and uncertainty.

Even if elections spur higher volatility there is no need to fear them. The reality is that long-term equity returns come from the value of individual companies over time. Smart investors would be wise to look past the short-term highs and lows and maintain a long-term focus. Need help on reviewing you long term investing? Reach out to schedule your free review meeting .

Here is this week’s market update.
Source: Capital Ideas

Securities offered through LPL Financial, Member FINRA/SIPC. E2E Financial is another business name of Independent Advisor Alliance, LLC. All investment advice is offered through Independent Advisor Alliance LLC, a registered investment advisor. Independent Advisor Alliance is a separate entity from LPL Financial.

The information contained in this e-mail message is being transmitted to and is intended for the use of only the individual(s) to whom it is addressed. If the reader of this message is not the intended recipient, you are hereby advised that any dissemination, distribution or copying of this message is strictly prohibited. If you have received this message in error, please immediately delete.

This information is not intended to be a substitute for specific individualized tax or legal advice. We suggest that you discuss your specific situation with a qualified tax or legal advisor.

This material is for general information only and is not intended to provide specific advice or recommendations for any individual. Investing involves risk including the possible loss of principal.

The S&P 500 is a stock market index tracking the stock performance of 500 of the largest companies listed on stock exchanges in the United States. Indexes are unmanaged and cannot be invested in directly.

The Standard & Poor’s 500 Index (S&P500) is a capitalization-weighted index of 500 stocks designed to measure performance of the broad domestic economy through changes in the aggregate market value of 500 stocks representing all major industries.
The Bloomberg U.S. Aggregate Index represents the U.S. investment-grade fixed-rate bond market. This index is unmanaged, and its results include reinvested dividends and/or distributions but do not reflect the effect of sales charges, commissions, account fees, expenses or U.S. federal income taxes.

Bonds are subject to market and interest rate risk if sold prior to maturity. Bond values will decline as interest rates rise and bonds are subject to availability and change in price.

This material is for general information only and is not intended to provide specific advice or recommendations for any individual. There is no assurance that the views or strategies discussed are suitable for all investors or will yield positive outcomes. Investing involves risks including possible loss of principal. Any economic forecasts set forth may not develop as predicted and are subject to change.

There is no guarantee that a diversified portfolio will enhance overall returns or outperform a non-diversified portfolio. Diversification does not protect against market risk.

Market Index captures broad US equity coverage. The index includes 3,204 constituents across large, mid, small and micro capitalizations, about 99% of the US equity universe. Indexes are unmanaged and cannot be invested in directly.
International investing involves special risks such as currency fluctuation and political instability and may not be suitable for all investors. These risks are often heightened for investments in emerging markets.

ARE YOU READY TO TAKE YOUR PRACTICE TO THE NEXT LEVEL?