Market Week: October 4, 2021

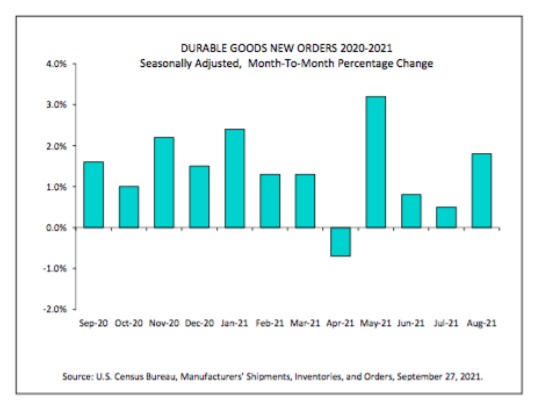
Durable Goods Up 15 of the Last 16 Months and Up 1.8% in August

Durable goods orders are new orders placed with domestic manufacturers for factory hard goods. In addition, the report compiled by the U.S. Census Bureau also contains information on shipments, unfilled orders and inventories. The advance release provides early estimates and is revised about a week later by the factory orders report.

On September 27th, the U.S. Census Bureau announced the August advance report on durable goods manufacturers’ shipments, inventories and orders.

New Orders

New orders for manufactured durable goods in August increased $4.6 billion or 1.8% to $263.5 billion.

  • This increase, up fifteen of the last sixteen months, followed a 0.5% July increase.
  • Excluding transportation, new orders increased 0.2%.
  • Excluding defense, new orders increased 2.4%
  • Transportation equipment, up three of the last four months, led the increase, $4.2 billion or 5.5% to $80.8 billion.

Shipments

Shipments of manufactured durable goods in August, down following three consecutive monthly increases, decreased $1.2 billion or 0.5% to $256.1 billion. This followed a 2.0% July increase. Transportation equipment, down following two consecutive monthly increases, drove the decrease, $2.0 billion or 2.7% to $73.5 billion.

Unfilled Orders

Unfilled orders for manufactured durable goods in August, up seven consecutive months, increased $11.8 billion or 1.0% to $1,239.3 billion. This followed a 0.5% July increase. Transportation equipment, up six of the last seven months, led the increase, $7.3 billion or 0.9% to $820.8 billion.

Inventories

Inventories of manufactured durable goods in August, up seven consecutive months, increased $3.4 billion or 0.8% to $457.9 billion. This followed a 0.8% July increase. Transportation equipment, also up seven consecutive months, led the increase, $1.3 billion or 0.8% to $153.4 billion.

Capital Goods

Nondefense new orders for capital goods in August increased $7.4 billion or 9.0% to $89.9 billion. Shipments increased $0.2 billion or 0.3% to $79.4 billion. Unfilled orders increased $10.5 billion or 1.4% to $754.9 billion. Inventories increased $0.9 billion or 0.4% to $201.2 billion. Defense new orders for capital goods in August decreased $1.0 billion or 8.3% to $11.4 billion. Shipments decreased $0.3 billion or 2.3% to $12.4 billion. Unfilled orders decreased $0.9 billion or 0.5% to $187.7 billion. Inventories increased $0.2 billion or 0.8% to $21.0 billion.

More Data Later in the Week

More economic data will be released later this week, including Pending Home Sales on Wednesday; GDP and Jobless Claims on Thursday and Construction Spending and Consumer Sentiment on Friday.

Click here to download a PDF of this report.

Securities offered through LPL Financial, Member FINRA/SIPC. E2E Financial is another business name of Independent Advisor Alliance, LLC. All investment advice is offered through Independent Advisor Alliance LLC, a registered investment advisor. Independent Advisor Alliance is a separate entity from LPL Financial.

The information contained in this e-mail message is being transmitted to and is intended for the use of only the individual(s) to whom it is addressed. If the reader of this message is not the intended recipient, you are hereby advised that any dissemination, distribution or copying of this message is strictly prohibited. If you have received this message in error, please immediately delete.

This information is not intended to be a substitute for specific individualized tax or legal advice. We suggest that you discuss your specific situation with a qualified tax or legal advisor.

This material is for general information only and is not intended to provide specific advice or recommendations for any individual. Investing involves risk including the possible loss of principal.

The S&P 500 is a stock market index tracking the stock performance of 500 of the largest companies listed on stock exchanges in the United States. Indexes are unmanaged and cannot be invested in directly.

The Standard & Poor’s 500 Index (S&P500) is a capitalization-weighted index of 500 stocks designed to measure performance of the broad domestic economy through changes in the aggregate market value of 500 stocks representing all major industries.
The Bloomberg U.S. Aggregate Index represents the U.S. investment-grade fixed-rate bond market. This index is unmanaged, and its results include reinvested dividends and/or distributions but do not reflect the effect of sales charges, commissions, account fees, expenses or U.S. federal income taxes.

Bonds are subject to market and interest rate risk if sold prior to maturity. Bond values will decline as interest rates rise and bonds are subject to availability and change in price.

This material is for general information only and is not intended to provide specific advice or recommendations for any individual. There is no assurance that the views or strategies discussed are suitable for all investors or will yield positive outcomes. Investing involves risks including possible loss of principal. Any economic forecasts set forth may not develop as predicted and are subject to change.

There is no guarantee that a diversified portfolio will enhance overall returns or outperform a non-diversified portfolio. Diversification does not protect against market risk.

Market Index captures broad US equity coverage. The index includes 3,204 constituents across large, mid, small and micro capitalizations, about 99% of the US equity universe. Indexes are unmanaged and cannot be invested in directly.
International investing involves special risks such as currency fluctuation and political instability and may not be suitable for all investors. These risks are often heightened for investments in emerging markets.

Don’t miss the next one. Subscribe for early access.

ARE YOU READY TO TAKE YOUR PRACTICE TO THE NEXT LEVEL?