EQUITY MARKETS JUMP ON SURPRISE RETAIL SALES AND BETTER-THANEXPECTED Q3 EARNINGS REPORTS FROM THE BIG BANKS
- U.S. equities turned in a terrific week, as Wall Street reacted favorably to much better-than-expected earnings reports and less negative economic data
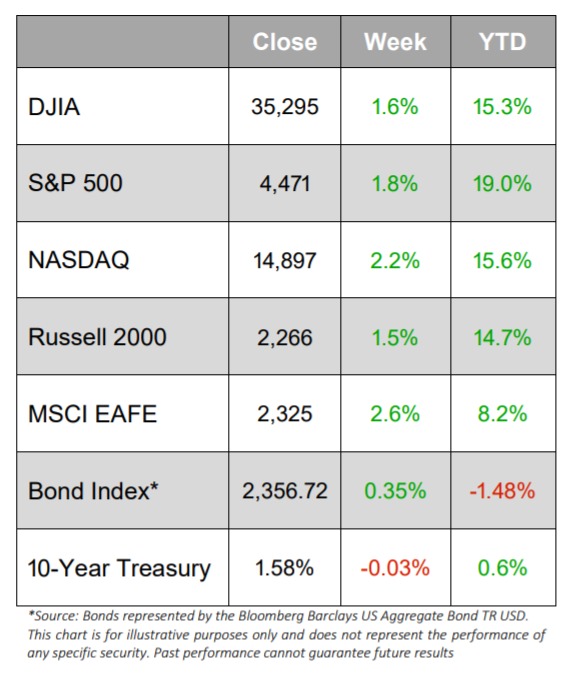
- NASDAQ (+2.2%) led the major markets, but the S&P 500 (+1.8%), DJIA (+1.6%), and the smaller-cap Russell 2000 (+1.5%) were not too far behind
- Almost all 11 of the S&P 500 sectors advanced on the week, with Communication Services (-0.4%) being the only sector in negative territory
- Three of the 11 sectors advanced over 3.5%, as Consumer Discretionary (+3.6%), Materials (+3.6%), and Real Estate (+3.5%) outperformed the broad market
- Wall Street seemed enamored with the beginning of the Q3 earnings season, as the larger banks came in ahead of expectations
- Goldman Sachs, Morgan Stanley, Bank of America, and JPMorgan all beat earnings estimates
- Bitcoin topped $60,000 for the first time since April
- There was a lot of economic data for investors to digest too, as retail sales came in stronger than anticipated and initial jobless claims were at their lowest level since the pandemic started
- But there was some not so positive economic news too, including more indications of inflation running hotter than previous months as the Consumer Price Index and Producer Price Index both ticked up
- WTI Crude was also up almost $3/barrel on the week and came to rest at more than $82/barrel
- • The 10-year Treasury yield pulled back a few basis points and ended at 1.58%
Equity Markets Advance as the Big Banks Report Q3 Earnings
U.S. equity markets rallied from Monday’s decline to end the week with some very positive gains, including the S&P 500 posting its biggest one-day gain since March.
At the beginning of the week, it appeared as if stocks might retreat and erase some of the previous week’s gain, as worries of supply chain issues and higher oil prices seemed to dampen Wall Street’s mood. And while both of those two worries continued to dominate the week’s headlines, Wall Street turned optimistic as inflation data pressures seemed to ease a bit.
Investors also saw their spirits lifted as minutes from the Federal Reserve’s September meeting indicated that current economic data points suggest that interest rates could be justified at near-zero conditions for the next couple of years.
Depending on your perspective, one might suggest that there was a decent amount of worrisome economic data, but Wall Street seemed more fixated on the earnings reports from the Big Banks as indicative of where the markets should head.
In economic news:
- Job openings and labor turnover (JOLTS) for August had fewer openings and new hires, while job separations increased.
- Job openings slipped to 10.439 million, and was the second highest on record after July’s 11.098
- Jobless claims fell more than expected to 293,000.
- US consumer price figures moved up 0.4% last month.
- PPI rose 0.5% last month to push the annual figure to 8.6%.
- Retail Sales for September were up 0.7%.
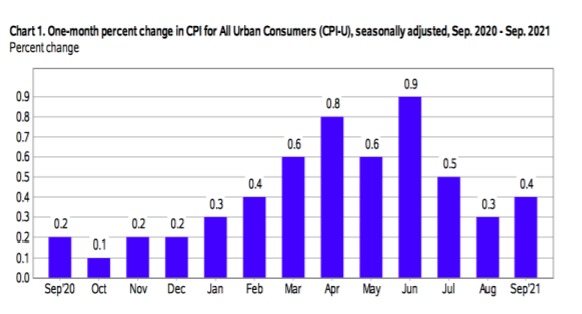
Consumer Price Index Rises Again
On Wednesday, the Bureau of Labor Statistics reported that the Consumer Price Index for All Urban Consumers (CPI-U) increased 0.4% in September on a seasonally adjusted basis after rising 0.3% in August. Over the last 12 months, the all items index increased 5.4% before seasonal adjustment.
“The indexes for food and shelter rose in September and together contributed more than half of the monthly all items seasonally adjusted increase. The index for food rose 0.9%, with the index for food at home increasing 1.2%. The energy index increased 1.3%, with the gasoline index rising 1.2%.
The index for all items less food and energy rose 0.2% in September, after increasing 0.1% in August.
Along with the index for shelter, the indexes for new vehicles, household furnishings and operations, and motor vehicle insurance also rose in September. The indexes for airline fares, apparel, and used cars and trucks all declined over the month.
The all items index rose 5.4% for the 12 months ending September, compared to a 5.3% rise for the period ending August. The index for all items less food and energy rose 4.0% over the last 12 months, the same increase as the period ending August. The energy index rose 24.8% over the last 12 months, and the food index increased 4.6% over that period.
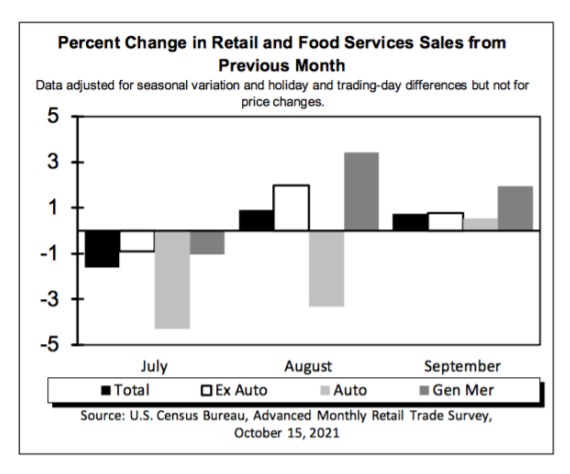
Retail Sales Up 13.9% From a Year Ago
On Friday, the U.S. Census Bureau announced estimates of U.S. retail and food services sales for September 2021 were $625.4 billion, an increase of 0.7% from the previous month, and 13.9% above September 2020.
- Total sales for the July 2021 through September 2021 period were up 14.9% from the same period a year ago.
- The July 2021 to August 2021 percent change was revised from up 0.7% to up 0.9%
- Retail trade sales were up 0.8% from August 2021, and up 12.2% above last year.
- Gasoline stations were up 38.2% from September 2020, while food services and drinking places were up 29.5% from last year.
Job Openings Still High at 10.4 Million
On Tuesday, the Labor Department reported that the number of job openings declined to 10.4 million on the last business day of August following a series high in July. Further:
- Hires decreased to 6.3 million while total separations were little changed at 6.0 million
- Within separations, the quits rate increased to a series high of 2.9% while the layoffs and discharges rate was little changed at 0.9%.
Job Openings
- The number and rate of job openings decreased to 10.4 million and 6.6%.
- Job openings decreased in several industries with the largest decreases in health care and social assistance (-224,000); accommodation and food services (-178,000); and state and local government education (-124,000).
- Job openings increased in federal government (+22,000).
- The number of job openings decreased in the Northeast and Midwest regions.
Hires
- The number and rate of hires decreased to 6.3 million (-439,000) and 4.3%
- Hires decreased in accommodation and food services (-240,000) and in state and local government education (-160,000).
- The number of hires decreased in the Midwest region.
Separations
Total separations includes quits, layoffs and discharges, and other separations. Quits are generally voluntary separations initiated by the employee. Therefore, the quits rate can serve as a measure of workers’ willingness or ability to leave jobs. Layoffs and discharges are involuntary separations initiated by the employer. Other separations includes separations due to retirement, death, disability, and transfers to other locations of the same firm.
- The number of quits increased in August to 4.3 million (+242,000).
- The quits rate increased to a series high of 2.9%.
- Quits increased in accommodation and food services (+157,000); wholesale trade (+26,000); and state and local government education (+25,000).
- Quits decreased in real estate and rental and leasing (-23,000)
- The number of quits increased in the South and Midwest regions.
By Company Size
- The job openings rate decreased in medium establishments with 50-249 employees.
- The hires rate decreased in large establishments with 250-999 employees.
- The layoffs and discharges rate decreased in medium establishments with 50-249 employees.
- The other separations rate decreased in large establishments with 1,000-4,999 employees.


