MARKETS MIXED AS LONG-TERM RATES RISE AND OIL LEAPS 7.6%
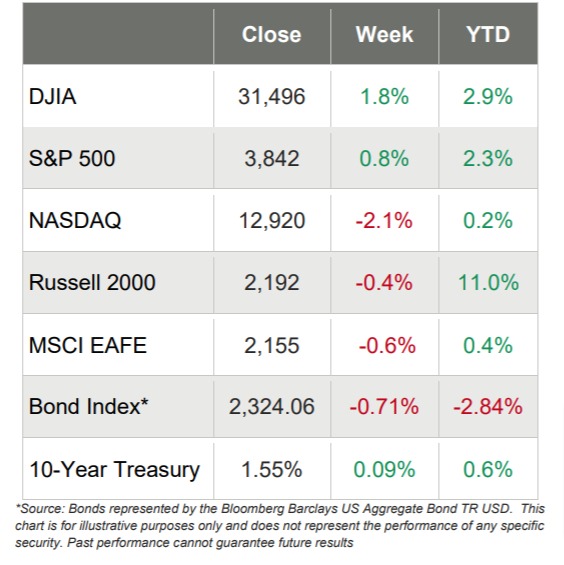
- U.S. equity markets endured a volatile week and ended mixed, with the mega-cap, 30-stock DJIA moving up 1.8% and the S&P 500 advancing a modest 0.8%
- The tech-laden NASDAQ and the smaller-cap Russell 2000 ended the week in negative territory, with NASDAQ dropping 2.1% and the Russell 2000 declining 0.4%
- Eight of the 11 sectors ended the week green, with the Energy sector climbing an astonishing 10.1% as the price of oil skyrocketed over 7% to end the week at $66.09/barrel
- The Financials sector (up 4.3%) and Industrials (up 3.1%) benefited from interest rates drifting higher, while Consumer Discretionary (down 2.8%) and Information Technology (down 1.4%) were hurt by rising rates
- The week started great as each of the indices advanced 2% on Monday after the FDA authorized Johnson & Johnson’s vaccine, the House passed an almost $2 trillion stimulus package and manufacturing came in better than expected
- But as the week wore on, long-term rates continued climbing, as the 10-year Treasury touched last week’s high of 1.61% before settling in at 1.55%, which was an increase of 9 basis points
- The rise in rates was driven by stronger-thanexpected jobs growth, with nonfarm payrolls increasing by 379,000 and nonfarm private payrolls increasing by 465,000 in addition to solid upward revisions for both numbers in January
Markets Mixed This Week as Rates Continue to Rise
The major U.S. stock indices were mixed as longer-term interest rates continued climbing. While the mega-cap DJIA and the large-cap S&P 500 managed weekly gains and NASDAQ and the Russell 2000 dropped, it is worth noting that both the DJIA and S&P 500 are ahead of NASDAQ on a YTD basis – and that hasn’t happened in quite some time. The rise in rates weighed more heavily on growth stocks versus value stocks, as evidenced by the impact on NASDAQ as a group. And Wall Street is trying to figure out if the rise in long-term rates was due to inflationary pressures or a resetting of expectations coming out of the pandemic shutdowns.
Within the S&P 500 sectors, the Energy sector outperformed every sector as it jumped double-digits on the week, as the price of oil hit levels not seen in over a year.
On Monday, the federal government began distributing the Johnson & Johnson single-dose vaccine, which was approved over the weekend, and the White House announced that every American adult would have access to vaccines by May, which was at least a couple of months early.
The proposed $1.9 trillion stimulus package was in the news all week, first as the Senate approved debate on the package. But as the week wore on, it appeared as if support was waning, especially as it relates to the controversial $15 minimum wage mandate.
Manufacturing Up for 9th Month in a Row
The February Manufacturing ISM Report On Business was the latest indicator suggesting that the U.S. manufacturing sector was digging out of the deep hole created by COVID-19. But the data is also a stark reminder of the challenges we have with supply chains and rising commodity prices.
For perspective, a reading above 50 indicates expansion in the manufacturing sector (the index bottomed out at a reading of around 41 in April 2020, when economic lockdowns were implemented, and the last few months have shown readings in the high 50s).
Released on Monday, March 1st, the Manufacturing PMIstood at 60.8%, its highest in about 3 years, which suggests that demand is robust. It was also the 9th consecutive month of growth. The flip side is that some prices have reached their highest level in over a decade, driven by supply chain issues and shortages of certain commodities.
From the ISM release:
“The February Manufacturing PMI registered 60.8 percent, an increase of 2.1 percentage points from the January reading of 58.7 percent. This figure indicates expansion in the overall economy for the ninth month in a row after contraction in March, April, and May.”
- The New Orders Index was up 3.7%
- The Production Index was up 2.5%
- The Backlog of Orders Index was up 4.3%
- The Employment Index was up 1.8%
- The Supplier Deliveries Index was up 3.8%
- The Inventories Index was down 1.1%
- The Prices Index was up 3.9 %
- The New Export Orders Index was up 2.3%
- The Imports Index was down 0.7%
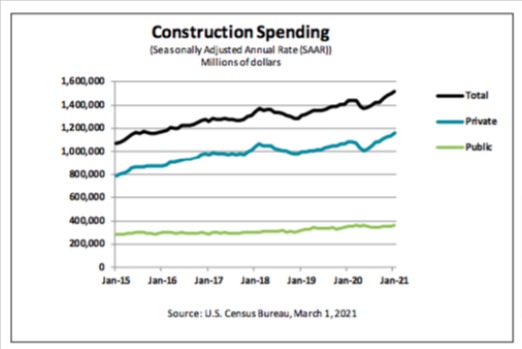
Construction Spending Climbs
On March 1st, the U.S. Department of Commerce reported that:
- Total construction spending during January 2021 was estimated at a seasonally adjusted annual rate of $1,521.5 billion, 1.7% above the December estimate and 5.8% above this time last year
- Spending on private construction was $1,160.0 billion, 1.7% above the December estimate
- Residential construction was $713.0 billion, 2.5% above the December estimate
- Nonresidential construction was $447.0 billion, 0.4% above the December estimate
Sectors Diverging More and More
The overall trend for sector performance for the first two months of 2021 was mixed, as performance leaders and laggards rotated throughout both months. Remember that February ended with 6 of the 11 in the red, which is 2 more than how many ended in the red YTD (two months is an exceptionally short time-period to suggest trends).
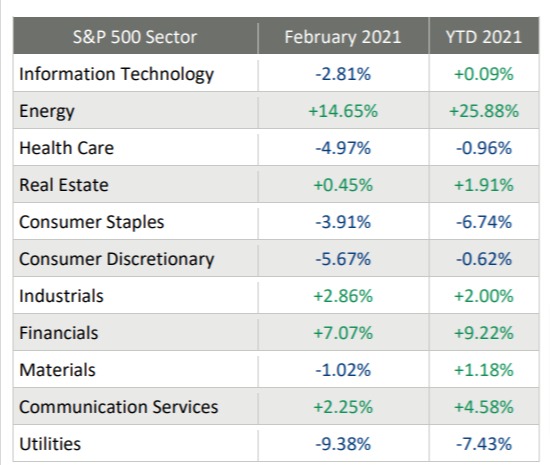
But investors would be wise to notice that the differences between the best performing and worst performing sectors in February was huge, with Energy up almost 15% and Utilities down almost 10%. On a YTD basis, the differences between the best and worst performing sectors is even more dramatic.
And this week, the differences between the best and worst was even more pronounced, as Energy leapt over 10% and Consumer Discretionary was down almost 3%. That is in just one week.


