MARKETS SURGE ON ANOTHER STIMULUS PACKAGE WHILE WALL STREET DIGESTS AND SHRUGS OFF A LOT OF ECONOMIC DATA
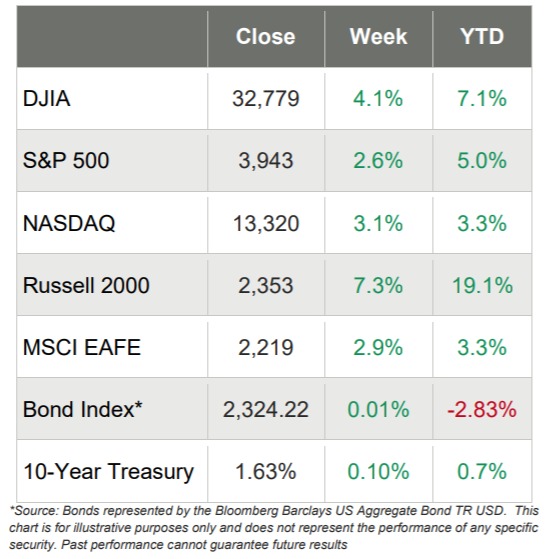
- The U.S. equity markets rocketed up this week, with the small-cap Russell 2000 leaping an astonishing 7.3% and pushing its YTD return close to 20%
- The narrowly focused DJIA hit a new intraday record every single day and ended the week up 4.1%
- The S&P 500 hit a new high too, ending the week up 2.6% while NASDAQ rebounded from prior weeks’ declines and added 3.1%
- Not surprisingly, every one of the 11 S&P 500 sectors moved up, with Consumer Discretionary and Real Estate each jumping 5.7%
- The Communication Services sector brought up the rear with a modest 0.7% gain on the week
- There was a lot of economic news on the week, but most of it was overshadowed by the $1.9 trillion stimulus bill becoming reality
- Weekly initial claims decreased by 42,000, which is its lowest level since November
- The 10-year Treasury jumped another 10 basis points and ended the week at 1.63%, its highest level in over a year
- The CBOE Volatility Index – the Fear Index – dropped 16% to 20.69
- WTC Crude dipped a little and then rallied midweek, but still lost about 50 cents a barrel and came to rest at $65.61/barrel
Markets Set All Kinds of Records This Week
Markets advanced significantly this week, with the DJIA hitting intraday highs on every single trading day as debate raged on about another stimulus package while Wall Street dismissed worries about inflation, vaccines, business re-openings and the job market.
When the final bell rang on Friday, the 30-stock DJIA had outpaced NASDAQ and the S&P 500 by a healthy amount, as it jumped 4.1% and NASDAQ and the S&P 500 moved up 3.1% and 2.6%, respectively. But the small-cap Russell 2000 leapt an incredible 7.1% on the week, putting it within a whisper of being up 20% YTD.
The week’s big news was out of Washington as the Senate approved the $1.9 trillion fiscal package, which fueled expectations for additional economic recovery. But there was a ton of economic data this week too, most of it good, including that:
- The U.S. goods and services deficit widened
- Initial jobless claims fell 42,000 to 712,000, below expectations
- Job openings rose 2.4% in January, way above expectations
- Consumer prices increased 0.4% in February, in-line with expectations
- On a 12-month basis, inflation picked up to 1.7%, inline with expectations
- The small business optimism index came in below expectations
Exports Up, But So are Imports
The U.S. Census Bureau and the U.S. Bureau of Economic Analysis announced on March 5th that the goods and services deficit was $68.2 billion in January, up $1.2 billion from $67.0 billion in December.
January exports were $191.9 billion, $1.8 billion more than December exports. January imports were $260.2 billion, $3.1 billion more than December imports.
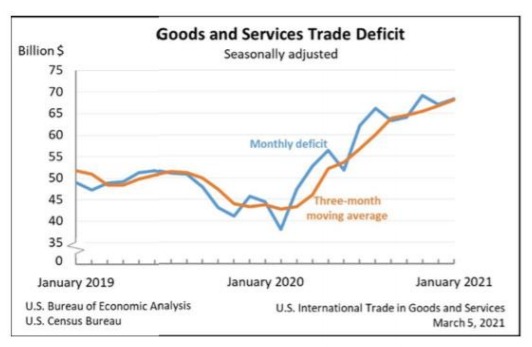
Year-over-year, the goods and services deficit increased $23.8 billion, or 53.7 percent, from January 2020. Exports decreased $15.7 billion or 7.6 percent. Imports increased $8.1 billion or 3.2 percent.
Exports of goods increased $2.1 billion to $135.7 billion in January:
- Industrial supplies and materials increased $2.5 billion;
- Capital goods increased $1.6 billion;
- Automotive vehicles, parts, and engines decreased $0.7 billion; and
- Exports of services decreased $0.3 billion to $56.3 billion in January.
Imports of goods increased $3.4 billion to $221.1 billion in January:
- Consumer goods increased $3.7 billion;
- Automotive vehicles, parts, and engines decreased $1.6 billion; and
- Imports of services decreased $0.3 billion to $39.0 billion in January.
In addition, the fourth-quarter figures show surpluses, in billions of dollars, with South and Central America ($13.2), Hong Kong ($6.3), Brazil ($4.2), United Kingdom ($4.0), Saudi Arabia ($3.7), and Singapore ($2.0). Deficits were recorded, in billions of dollars, with China ($80.0), European Union ($36.8), Mexico ($33.6), Germany ($17.1), Japan ($16.7), India ($10.1), Italy ($8.9), Taiwan ($8.7), South Korea ($7.0), France ($4.0), and Canada ($0.3).
Jobless Claims Falling
Initial jobless claims fell 42,000 to 712,000 in the week ended March 6, coming in at the low end of forecasts, which had predicted about 725,000. The report confirmed improvement in the labor market when nonfarm payrolls soared 379,000 and the unemployment rate edged down to 6.2%.
The March 6 initial claims reading was the lowest since 711,000 in the November 7, 2020 week, remaining below the 800,000 mark for the third consecutive week. Further, the 4- week average was down 34,000 to 759,000, its lowest level since November 28, 2020.
Equally important was the data that reported that continuing claims, which lag by a week, fell 193,000 to 4.144 million, the lowest level in nearly a year, bringing down the unemployment rate for insured workers to 2.9%. This was the first time the rate fell below 3.0% since the March 14 pre-pandemic week.
Inflation Rising, But Appears in Check
Mostly as expected, consumer prices rose modestly in February, increasing 0.4% and continuing the trend since last November. On a 12-month basis, inflation moved up 1.7%. The monthly increase, the largest since August 2020 when prices moved up 0.4%, but was driven mostly by a 6.4% gain in gasoline prices, as overall energy prices moved up 3.9% last month.
From the U.S. Bureau of Labor Statistics release dated March 10, 2021:
“The gasoline index continued to increase, rising 6.4 percent in February and accounting for over half of the seasonally adjusted increase in the all items index. The electricity and natural gas indexes also increased, and the energy index rose 3.9 percent over the month. The food index rose 0.2 percent in February, with the index for food at home and the index for food away from home both rising.
The index for all items less food and energy rose 0.1 percent in February. The indexes for shelter, recreation, medical care, and motor vehicle insurance all increased over the month. The indexes for airline fares, used cars and trucks, and apparel all declined in February.”
Mortgage Applications Drop From Last Week
On March 10th, the Mortgage Bankers Association announced that mortgage applications decreased 1.3% from one week earlier, according to the MBA Weekly Mortgage Applications Survey for the week ending March 5, 2021. Further from the MBA’s release:
- The Refinance Index decreased 5% from the previous week and was 43% lower than the same week one year ago.
- The seasonally adjusted Purchase Index increased 7%from one week earlier.
- The 30-year fixed mortgage rate climbed to 3.26 percent last week, which is the highest since last July and up 40 basis points since the start of 2021.
- The average contract interest rate for 30-year fixedrate mortgages with conforming loan balances ($548,250 or less) increased to 3.26 percent from 3.23 percent, with points decreasing to 0.43 from 0.48 (including the origination fee) for 80 percent loan-to-value ratio (LTV) loans. The effective rate increased from last week.
- The average contract interest rate for 30-year fixedrate mortgages with jumbo loan balances (greater than $548,250) increased to 3.34 percent from 3.33 percent, with points increasing to 0.50 from 0.41 (including the origination fee) for 80 percent LTV loans.


