Producer Price Index for Final Demand Up 6.6% for 12-months Ending May
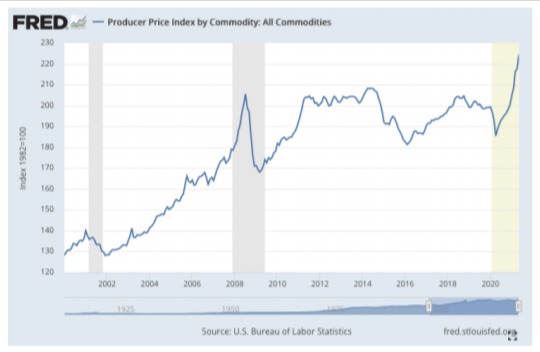
The U.S. Bureau of Labor Statistics publishes the Producer Price Index (PPI) which is a group of indexes that calculates and represents the average movement in selling prices from domestic production over time.
The PPI is different from the Consumer Price Index (CPI) in that it measures costs from the viewpoint of industries that make products, whereas the CPI measure prices from the perspective of consumers.
On Tuesday, June 15th, the U.S. Bureau of Labor Statistics reported the Producer Price Index for final demand increased 0.8% in May, seasonally adjusted. Further, final demand prices rose 0.6% in April and 1.0% in March.
But on an unadjusted basis, the final demand index advanced 6.6% for the 12 months ended in May, the largest increase since 12-month data were first calculated in November 2010.
More from the release:
“Nearly 60 percent of the May increase in the index for final demand can be traced to a 1.5-percent rise in prices for final demand goods. The index for final demand services moved up 0.6 percent.
Prices for final demand less foods, energy, and trade services increased 0.7 percent in May, the same as in April. For the 12 months ended in May, the index for final demand less foods, energy, and trade services climbed 5.3 percent, the largest increase since 12-month data were first calculated in August 2014.
Final demand goods: Prices for final demand goods advanced 1.5 percent in May after rising 0.6 percent in April. Over 40 percent of the broad-based increase in May can be traced to the index for final demand goods less foods and energy, which moved up 1.1 percent. Prices for final demand foods and for final demand energy also advanced, 2.6 percent and 2.2 percent, respectively.
Product detail: Within the index for final demand goods in May, prices for nonferrous metals rose 6.9 percent. The indexes for beef and veal; diesel fuel; gasoline; hay, hayseeds, and oilseeds; and motor vehicles also advanced. In contrast, prices for fresh fruits and melons declined 1.9 percent. The indexes for primary basic organic chemicals and for asphalt also moved lower.
Final demand services: Prices for final demand services rose 0.6 percent in May, the fifth consecutive increase. Forty percent of the broad-based May advance can be traced to the index for final demand trade services, which moved up 0.7 percent. (Trade indexes measure changes in margins received by wholesalers and retailers.) Prices for final demand services less trade, transportation, and warehousing and for final demand transportation and warehousing services also rose, 0.2 percent and 1.9 percent, respectively.
Product Detail: Over 40 percent of the May increase in the index for final demand services is attributable to margins for automobile retailing (partial), which jumped 27.3 percent. The indexes for truck transportation of freight; apparel, footwear, and accessories retailing; portfolio management; chemicals and allied products wholesaling; and hardware, building materials, and supplies retailing also rose. Conversely, margins for food retailing fell 3.6 percent. The indexes for traveler accommodation services and for airline passenger services also decreased.”
More Data Later in the Week
More economic data will be released later this week, including Housing Starts and Permits on Wednesday and Jobless Claims on Thursday.


