MARKETS SHAKE OFF DELTA VARIANT WORRIES AND WEAKENING ECONOMIC DATA ON THE WAY TO NEW RECORD HIGHS
- Despite starting the week in worrisome territory, the markets rebounded as investors “bought-the dip,” pushing the S&P 500, NASDAQ and DJIA to record highs by week’s end
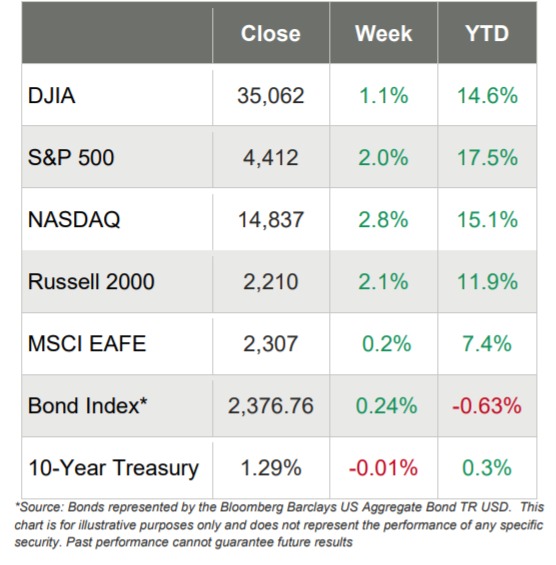
- NASDAQ led the way with a weekly gain of 2.8%, followed closely by the Russell 2000 (+2.2%), the S&P 500 (+2.0%), and the DJIA (+1.1%)
- Wall Street was worried on Monday that the delta variant might derail the recovery and lead to renewed economic closures, but shrugged off those concerns as the week wore on, closing higher every other day to end in record territory
- Of the 11 S&P 500 sectors, 9 ended higher, led by Communication Services (+3.2%), Consumer Discretionary (+2.9%), and Information Technology (+2.2%), with the Energy (-0.4%) and Utilities (- 0.9%) sectors losing less than 1%
- Building permits declined 5.1% from the previous month and came in lower than expected
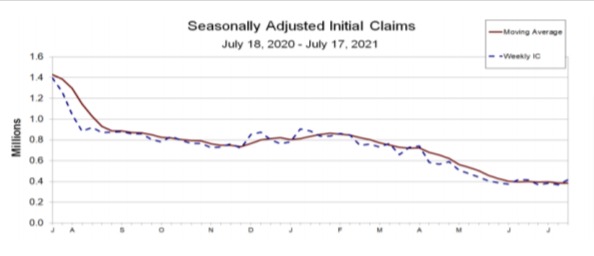
- Weekly initial claims reached their highest level since mid-May, coming in at 419,000, much higher than expected
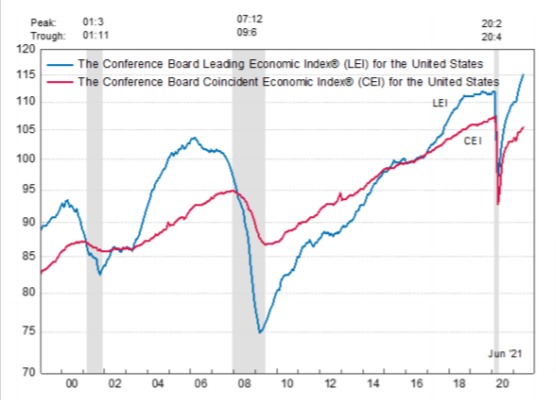
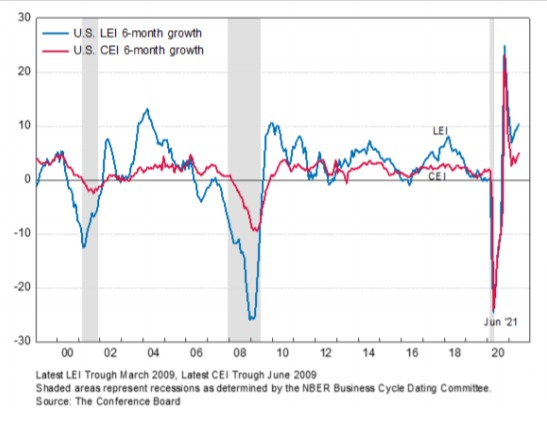
- The Conference Board’s Leading Economic Index increased, but not as much as analysts were expecting
- The 10-year Treasury yield ended the week only down one basis point to 1.29%, although it did retreat to below 1.14% earlier in the week
Major Hit New Record Highs
The week started with a lot of worry, as headlines screaming “Market Sell-Off” and “Markets Tank” were everywhere. And why not, since the S&P 500 had dropped 3% in five days by the time Monday closed. But then one of two things happened: either 1) investors started “buying the dip” or 2) Wall Street just wasn’t reading headlines. Because for each of the next four days, the markets marched higher, pushing NASDAQ, the DJIA and the S&P 500 to record highs.
Besides worries about the delta variant and whether it will lead to renewed business closings and mask mandates, the markets digested a healthy slate of economic news and on balance, the news leaned a bit more toward the negative side:
- Jobless claims were higher than expected
- Companies were reporting earnings results that were better than expected by recent and historical measures
- Building permits were off by more than 5% monthover-month
- The Conference Board Leading Indicators were up, but up by less than predicted
- Housing indicators were mixed, but lumber prices remain elevated and are adding significant costs to new home-builders and renters
Companies Beating Earnings Estimates
While less than 25% of S&P 500 companies have reported earnings results for the second quarter of 2021, as of Friday more companies are beating estimates relative to historical averages – and beating those estimates by a wider margin too.
As such, the overall result is that collective earnings are higher this week relative to just last week and higher relative to the previous quarter. Yes, it’s true that some of the relative numbers are off of weaker earnings due to COVID, but overall the trend is encouraging, causing analysts to expect double-digit earnings growth for the rest of the year.
From research firm FactSet’s press release as of the end of market close on Friday:
“Overall, 24% of the companies in the S&P 500 have reported actual results for Q2 2021 to date. Of these companies, 88% have reported actual EPS above estimates, which is above the five-year average of 75%. If 88% is the final percentage for the quarter, it will mark the highest percentage of S&P 500 companies reporting a positive EPS surprise since FactSet began tracking this metric in 2008. In aggregate, companies are reporting earnings that are 19.0% above estimates, which is also above the five-year average of 7.8%. If 19.0% is the final percentage for the quarter, it will mark the fourth largest earnings surprise percentage reported by the index since FactSet began tracking this metric in 2008.”
Jobless Claims Higher than Expected
On Thursday, the Department of Labor reported that for the week ending July 17th, initial claims were 419,000, an increase of 51,000 from the previous week’s level. In addition:
- The 4-week moving average was 385,250, an increase from the previous week’s average
- The insured unemployment rate was 2.4%, unchanged from the previous week’s rate
- The insured unemployment during the week ending July 10th was 3,236,000, which is the lowest level for insured unemployment since March 21, 2020 when it was 3,094,000
Conference Board Leading Indicators Increase
Also on Thursday, it was reported that the Conference Board Leading Economic Index for the U.S. increased by 0.7% in June, after a 1.2% increase in May and a 1.3% gain in April. In addition:
- The Conference Board Coincident Economic Index for the U.S. increased by 0.4% in June, following a 0.5% increase in May and a 0.1% increase in April
- The Conference Board Lagging Economic Index for the U.S. was unchanged in May, following a 0.6% increase in May and 3.0% increase in April
Lumber Prices Adding $30K to the Price of a New Home
On Monday, the National Association of Home Builders released its survey of home builders which gauges builder perceptions of current single-family home sales and sales expectations for the next six (any number over 50 indicates that more builders view conditions as good than poor). The NAHB reported that:
- The HMI index gauging current sales conditions fell one point to 86;
- The component measuring traffic of prospective buyers dropped six points to 65; and
- The gauge charting sales expectations in the next six months posted a two-point gain to 81.
Among the supply-side challenges, the price of lumber and OSB (oriented strand board) has been a particular problem lately. And such, cost increases are putting upward pressures on home prices and sidelining many prospective home buyers.
The good news is that lumber prices have declined recently – the bad news is that framing lumber prices are still about twice as high as they were in April of 2020.
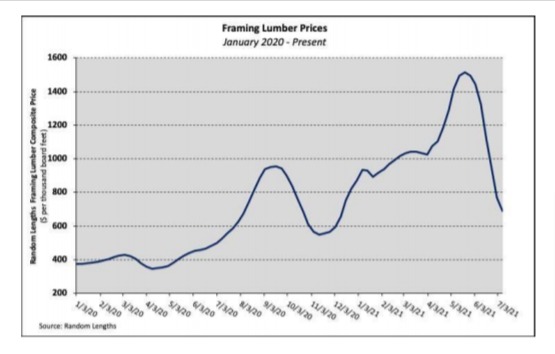
But what you might not know is that framing lumber is only one of the softwood lumber products used in the average home. Other products include plywood, oriented strand board, particleboard, fiberboard, shakes and shingles.
For perspective, the average new single-family home uses more than 2,200 square feet of softwood plywood and more than 6,800 square feet of OSB (according to estimates developed from the Builder Practices Survey).
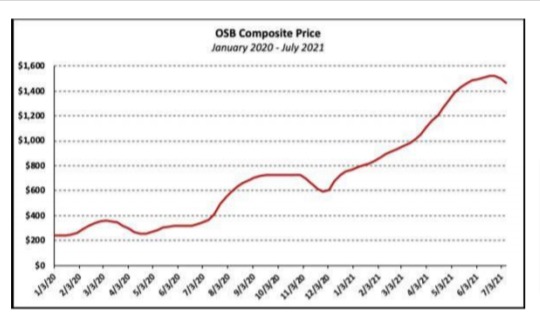
And since April 2020, the price of softwood plywood has increased by more than 200% – and the price of OSB has skyrocketed by nearly 500%.
The end result is that the OSB-led changes in softwood lumber prices that occurred between April 2020 and July 2021 have added $29,833 to the price of an average new single-family home and $9,990 to the market value of an average new multifamily home.
Based on the average rent-to-value ratio in the most recent HUD/Census Rental Housing Finance Survey, the increase in builder cost and market value for a multifamily structure means tenants pay $92 more a month to rent the average new apartment due to the change in softwood lumber prices.


