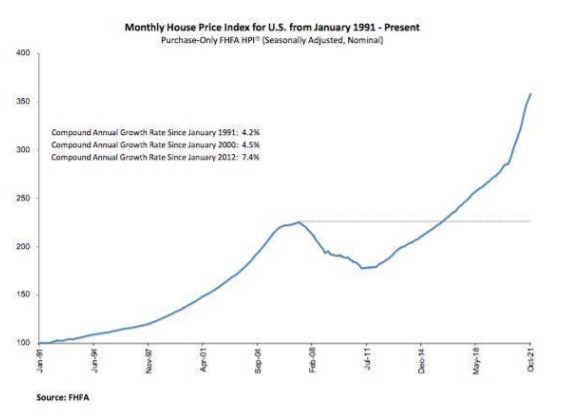
Housing Stays Red-Hot: Prices Up 1% From Last Month and Over 17% From Last Year
The Federal Housing Finance Agency House Price Index is the nation’s only collection of public, freely available house price indexes that measure changes in single-family home values based on data from all 50 states and over 400 American cities that extend back to the mid-1970s.
The FHFA HPI incorporates tens of millions of home sales and offers insights about house price fluctuations at the national, census division, state, metro area, county, ZIP code, and census tract levels. FHFA uses a fully transparent methodology based upon a weighted, repeatsales statistical technique to analyze house price transaction data.
On Tuesday, the Federal Housing Finance Agency announced that prices rose nationwide in October, up 1.1% from the previous month, according to its latest Federal Housing Finance Agency House Price Index.
House prices rose 17.4% from October 2020 to October 2021. The previously reported 0.9% price change for September 2021 remained unchanged.
Further:
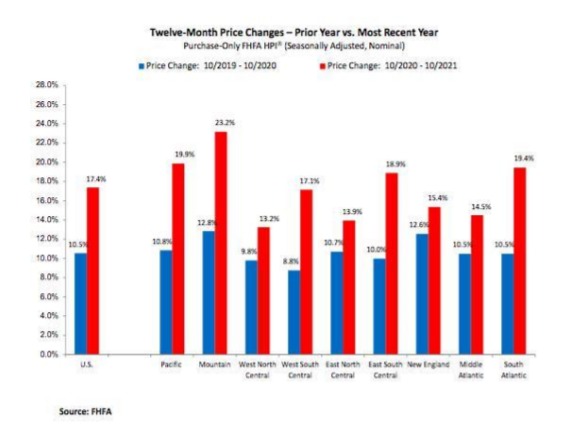
- For the nine census divisions, seasonally adjusted monthly house price changes from September 2021 to October 2021 ranged from – 0.3 percent in the New England division to +1.7 percent in the East South Central division
- The 12-month changes ranged from +13.2 percent in the West North Central division to +23.2 percent in the Mountain division.
“House price levels continue to rise but the rapid pace is curtailing through October,” said Will Doerner, Ph.D., Supervisory Economist in FHFA’s Division of Research and Statistics.
“The large market appreciations seen this spring peaked in July and have been cooling this fall with annual trends slowing over the last four consecutive months.”
More Data Later This Week
More economic data will be released later this week, including EIA Petroleum Status Report on Wednesday and EIA Natural Gas Report on Thursday.
Click here to download a PDF of this report.
Weekly Market Recap
The week in review
- Case-Shiller U.S. HPI rose 0.9% m/m
- Pending home sales declined 2.6% m/m
The week ahead
- Manufacturing/services PMIs
- Unemployment
Thought of the week
2021 was a solid year for financial markets, as the economy’s ability to adapt to the pandemic, the rollout of vaccines, the passing of additional fiscal stimulus and easy monetary policy all supported strong developed market equity and commodity performance. Improved mobility and declining vacancy rates drove REITs to the front of the line, with the FTSE Nareit index delivering a 39.9% return. Within the space, the top performers were regional malls, shipping centers and apartments. Following REITs were large cap U.S. equities and commodities, which were up 28.7% and 27.1%, respectively. The strong performance in large cap U.S. equities was primarily driven by unprecedented gains among the S&P 500’s largest tech stocks.
Turning to commodities, severe supply chain bottlenecks and a surge in energy prices supported performance. In contrast to 2020, small cap U.S. equities trailed their large cap peers with a 14.8% return, although this was still above the 20-year average of 11.0%. Outside the U.S., equities
in developed markets ex-U.S. had another strong year with an 11.8% return; emerging market equities, on the other hand, contracted 2.2%, following a correction in the Chinese stock market in 2H21 and
continued lockdown measures throughout the region. Lastly, U.S. fixed income decreased 1.5%, as long term interest rates ended the year higher than they started. Looking ahead to 2022, we expect further
recovery in emerging markets and a gradual fading of accommodative fiscal and monetary policy in developed markets as the world gradually moves past the pandemic.


