While Housing Starts reflect real commitments from home builders, there is another index that asks builders to rate housing conditions and the general economy. Compiled by the National Association of Home Builders, this index is a weighted average of a many indexes, including: present sales of new homes, sales of new homes expected in the next six months, and traffic of prospective buyers in new homes.
According to the latest from the NAHB: “Growing inflation concerns and ongoing supply chain disruptions snapped a four-month rise in home builder sentiment even as consumer demand remains robust.”
Further:
- Builder confidence in the market for newly built single-family homes moved one point lower to 83 in January.
- The HMI has hovered at the 83 or 84 level, the same rate as the spring of 2021, for the past three months.
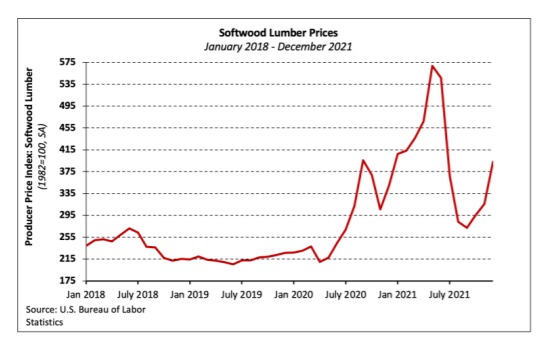
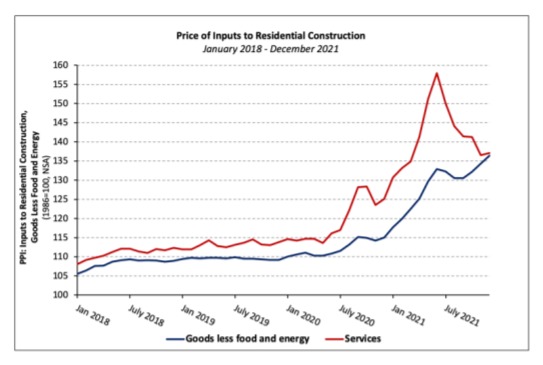
“Higher material costs and lack of availability are adding weeks to typical single-family construction times,” said NAHB Chairman Chuck Fowke. “NAHB analysis indicates the aggregate cost of residential construction materials has increased almost 19% since December 2021. Policymakers need to take action to fix supply chains. Obtaining a new softwood lumber agreement with Canada and reducing tariffs is an excellent place to start.”
“The HMI data was collected during the first two weeks of January and do not fully reflect the recent jump in mortgage interest rates,” said NAHB Chief Economist Robert Dietz. “While lean existing home inventory and solid buyer demand are supporting the need for new construction, the combination of ongoing increases for building materials, worsening skilled labor shortages and higher mortgage rates
point to declines for housing
affordability in 2022.”
“The HMI index gauging current sales conditions held steady at 90, the gauge measuring sales expectations in the next six months fell two points to 83, and the component charting traffic of prospective buyers also posted a two-point decline to 69.
Looking at the three-month moving averages for regional HMI scores:
- The Northeast fell one point to 73;
- The Midwest increased one point to 75; and
- The South and West each posted a one-point rise
to 88, respectively.
More Data Later This Week More economic data will be released later this week, including MBA Mortgage Applications on Wednesday; Jobless Claims on Thursday; and Leading Indicators on
Friday.
Click here to download a PDF of this report.
Weekly Market Recap
The week in review
- Initial claims increased to 286.0K
- Existing home sales decreased to 6,180K
- Housing starts increased 1.4% m/m
The week ahead
- Manufacturing & services PMIs
- FOMC meeting
- 4Q21 Real GDP
- PCE deflator
Thought of the week
With 14.4% of market cap reporting, our current estimate for 4Q21 S&P 500 operating earnings per share (EPS) is $51.31 ($42.61 ex-financials). If realized, this would represent y/y growth of 34.4%. On a sequential basis, however, we are tracking a decline of 1.4%, as the rapid spread of Omicron, disrupted supply chains, higher input costs and a stronger dollar all weighed on profits. At the sector level, financials are in line to see earnings contract 24.5% versus 4Q20 due to massive reserve releases this time last year, the normalization of trading and mortgage activity and subdued loan growth. There has also been an uptick in noninterest expenses due to higher wages, which has pressured profit margins. Meanwhile, soaring oil and natural gas prices and economic growth in 4Q should support results in the energy, materials and industrial sectors, which are currently tracking y/y earnings growth of 231.5%, 59.8% and 169.9%, respectively. Industrials are set to see a q/q decline in earnings, however, as supply shortages and the delayed recovery in air travel weighed on performance. Moving to growth, tech is set for another strong quarter of earnings, with software-based businesses continuing to drive profits. Profits in the consumer discretionary sector will likely see a second consecutive quarter of an earnings contraction, as mixed consumer spending data, supply shortages and higher commodity and freight costs hurt the sector’s profitability. According to the BEA, real consumer spending increased +0.7% m/m in October but remained flat in November. Furthermore, labor shortages induced by increasing COVID-19 cases in southeast and east Asia have led to factories falling short of production. We are currently tracking a y/y and q/q EPS decline of 0.8% and 16.1%, respectively, for the sector. As the earnings season unfolds, the focus will be on companies’ ability to defend profit margins against a backdrop of higher wages and supply constraints.


