Market Week: January 10, 2022

Manufacturing Sector Shows 19th Consecutive Month of Growth

The December Manufacturing ISM Report On Business was the latest indicator suggesting that the U.S. manufacturing sector (which helps drive the U.S. economy) is digging out of the deep hole created by COVID-19. But the data is also a stark reminder of the challenges we have with supply chains and rising commodity prices.

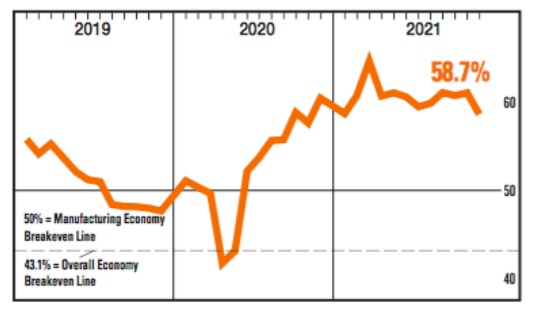
For perspective, a reading above 50 indicates expansion in the manufacturing sector. Further, the index bottomed out at a reading of around 41 in April 2020, when economic lockdowns were implemented, and the last few months have shown readings in the high 50s and low 60s

Released on Tuesday, January 4th, “Economic activity in the manufacturing sector grew in December, with the overall economy achieving a 19th consecutive month of growth.”

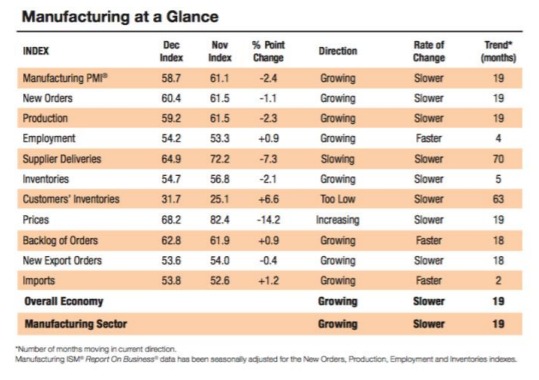
“The December Manufacturing PMI® registered 58.7 percent. The New Orders Index registered 60.4 percent,
down 1.1 percentage points compared to the November reading of 61.5 percent.

The Production Index registered 59.2 percent, a decrease of 2.3 percentage points compared to the November reading of 61.5 percent. The Prices Index registered 68.2 percent, down 14.2 percentage points compared to the November figure of 82.4 percent. The Backlog of Orders Index registered 62.8 percent, 0.9 percentage point higher than the November reading of 61.9 percent.

The 15 manufacturing industries reporting growth in December — in the following order — are: Apparel, Leather & Allied Products; Furniture & Related Products; Textile Mills; Plastics & Rubber Products; Machinery; Nonmetallic Mineral Products; Miscellaneous Manufacturing; Chemical Products; Electrical Equipment, Appliances & Components; Fabricated Metal Products; Computer & Electronic Products; Food, Beverage & Tobacco Products; Transportation Equipment; Primary Metals; and Petroleum & Coal Products. The three industries reporting a decrease in December compared to November are: Wood Products; Printing & Related Support Activities; and Paper Products.

All of the six biggest manufacturing industries — Chemical Products; Fabricated Metal Products; Computer & Electronic Products; Food, Beverage & Tobacco Products; Transportation Equipment; and Petroleum & Coal Products, in that order — registered moderate-to-strong growth in December.”

More Data Later This Week
More economic data will be released later this week, including Motor Vehicle Sales on Wednesday; Factory Orders on Thursday; and the Employment Situation Report on Friday.

Click here to download a PDF of this report.

Weekly Market Recap

The week in review

  • Nonfarm payrolls: +199K
  • JOLTS job openings: +10,562K
  • Light vehicle sales: 12.4M

Click here to download a PDF of this report.

Securities offered through LPL Financial, Member FINRA/SIPC. E2E Financial is another business name of Independent Advisor Alliance, LLC. All investment advice is offered through Independent Advisor Alliance LLC, a registered investment advisor. Independent Advisor Alliance is a separate entity from LPL Financial.

The information contained in this e-mail message is being transmitted to and is intended for the use of only the individual(s) to whom it is addressed. If the reader of this message is not the intended recipient, you are hereby advised that any dissemination, distribution or copying of this message is strictly prohibited. If you have received this message in error, please immediately delete.

This information is not intended to be a substitute for specific individualized tax or legal advice. We suggest that you discuss your specific situation with a qualified tax or legal advisor.

This material is for general information only and is not intended to provide specific advice or recommendations for any individual. Investing involves risk including the possible loss of principal.

The S&P 500 is a stock market index tracking the stock performance of 500 of the largest companies listed on stock exchanges in the United States. Indexes are unmanaged and cannot be invested in directly.

The Standard & Poor’s 500 Index (S&P500) is a capitalization-weighted index of 500 stocks designed to measure performance of the broad domestic economy through changes in the aggregate market value of 500 stocks representing all major industries.
The Bloomberg U.S. Aggregate Index represents the U.S. investment-grade fixed-rate bond market. This index is unmanaged, and its results include reinvested dividends and/or distributions but do not reflect the effect of sales charges, commissions, account fees, expenses or U.S. federal income taxes.

Bonds are subject to market and interest rate risk if sold prior to maturity. Bond values will decline as interest rates rise and bonds are subject to availability and change in price.

This material is for general information only and is not intended to provide specific advice or recommendations for any individual. There is no assurance that the views or strategies discussed are suitable for all investors or will yield positive outcomes. Investing involves risks including possible loss of principal. Any economic forecasts set forth may not develop as predicted and are subject to change.

There is no guarantee that a diversified portfolio will enhance overall returns or outperform a non-diversified portfolio. Diversification does not protect against market risk.

Market Index captures broad US equity coverage. The index includes 3,204 constituents across large, mid, small and micro capitalizations, about 99% of the US equity universe. Indexes are unmanaged and cannot be invested in directly.
International investing involves special risks such as currency fluctuation and political instability and may not be suitable for all investors. These risks are often heightened for investments in emerging markets.

Don’t miss the next one. Subscribe for early access.

ARE YOU READY TO TAKE YOUR PRACTICE TO THE NEXT LEVEL?