MARKETS MARCH TO NEW HIGHS AS CONGRESS WRITES A $1 TRILLION INFRASTRUCTURE BILL AND COMPANIES REPORT EARNINGS SURPRISES
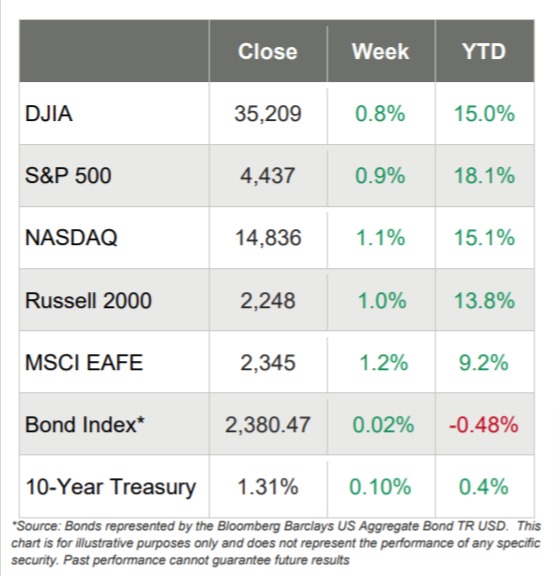
- The first week in August ended well for investors, as the three large-cap U.S. indices all hit record closing highs
- NASDAQ led the way with a gain of 1.1%, followed closely by the 1.0% gain for the smaller cap Russell 2000 and the S&P 500’s return of 0.9% and the DJIA’s gain of 0.8%
- Both growth stocks and value stocks did well this week and of the 11 S&P 500 sectors, only the Consumer Staples sector turned in negative weekly numbers as it dropped 0.6%
- The Financials sector leapt 3.6% and the Utilities sector jumped 2.3% while the other 8 positive sectors were up less than 1%
- There was a lot of economic data for Wall Street to digest, including that the Employment Situation report for July came in better than expected, adding 943,000 to nonfarm payrolls
- In addition, weekly jobless claims were under 3 million for the first time since the COVID pandemic started
- The July ISM Non-Manufacturing Index increased to a record high of 64.1%
- There was also a slew of companies reporting earnings and the trend of better than expected earnings continued for the most part
- Wall Street also seemed pleased with the $1 trillion infrastructure bill that might pass the Senate in the next few days
- The 10-year Treasury yield dropped to 1.13% earlier in the week, but rose to end the week at 1.29%
- WTI Crude dropped 8% on the week and ended around $68/barrel, its biggest drop in about 9 months
Markets March to New Record Highs
U.S. stock markets gained on the week, as the tech-laden NASDAQ, mega-cap DJIA and the large-cap S&P 500 all ended the week in record territory.
The week started off with a few worries – principally over the Delta variant and concerns that peak growth had already passed.
But as the week wore on and generally positive economic data started to trickle in, markets moved higher. Specifically, the data that was recorded included:
- The Employment Situation report for July coming in higher than expected, with 943,000 additions to nonfarm payrolls
- Manufacturing activity in the U.S., as well as in Europe and Asia, remaining in “expansionary territory” for the month of July
- In the U.S. during June, imports were greater than exports, driven somewhat by surging demand amidst supply chain challenges
- Weekly jobless claims were below 3 million
Earnings Surprises Continue
There was also a lot of positive earnings news too, as companies continued to beat consensus estimates by a healthy amount.
In fact, research firm FactSet reports that the S&P 500 is currently reporting the highest year-over year growth in earnings since Q4 2009. Further, FactSet reported that analysts are expecting double digit earnings growth for the second half of 2021.
As of Friday, almost 90% of companies in the S&P 500 have reported results for the second quarter and of these companies:
- If 87% is the final percentage for the quarter, it will mark the highest percentage of S&P 500 companies reporting a positive EPS surprise since FactSet began tracking this metric in 2008
- In aggregate, companies are reporting earnings that are 17.1% above estimates, which is also above the five-year average of 7.8%
- If 17.1% is the final percentage for the quarter, it will mark the fourth-largest earnings surprise percentage reported by the index since FactSet began tracking this metric in 2008
Infrastructure Bill Released
Wall Street generally seemed pleased that Congress unveiled the text of its infrastructure bill and it could be put to a Senate vote this weekend. The White House released the following summary of the proposal:
- $110 billion for roads, bridges, and major transportation projects.
- $66 billion for passenger rail, including $16 billion for Amtrak’s National Network, $6 billion for Amtrak’s Northeast Corridor, and $36 billion for Federal-State Partnership Grants including a $24 billion set-aside for the Northeast Corridor.
- $11 billion for safety for the National Highway Traffic Safety Administration, Federal Motor Carrier Safety Administration, Pipeline and Hazardous Material Safety Administration, and a “Safe Streets for All” program.
- $39 billion for transit, including for Capital Investment Grants and the “low-no” emission vehicle procurement program.
- $25 billion for airports.
- $17.3 billion for ports and waterways
- $46 billion for infrastructure resiliency investments.
- $7.5 billion for low-carbon and zero-emission school buses and ferries along with another $7.5 billion for electric vehicles and low-carbon school buses and ferries.
- $65 billion for broadband, $55 billion for water infrastructure, along with $73 billion for power and electric grid infrastructure investment.
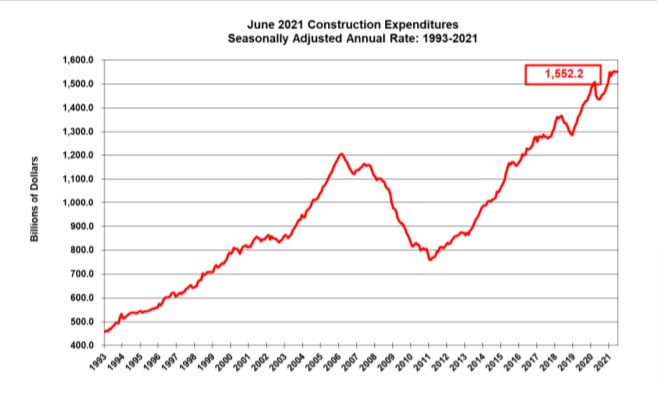
Current Construction for June Mostly Positive Too
On Tuesday, the U.S. Census Bureau announced that construction spending during June 2021 was $1,552.2 billion, which is 8.2% above the June 2020 estimate.
Further:
- Spending on private construction was $1,215.2 billion, 0.4% above May’s spending
- Public construction spending was $337.0 billion, 1.2% below May’s spending
reported that analysts are expecting double-digit earnings growth for the second half of 2021.