THE S&P 500 HITS ITS 50TH RECORD HIGH THIS YEAR DESPITE UNREST IN AFGHANISTAN AS OIL JUMPS ALMOST 10%
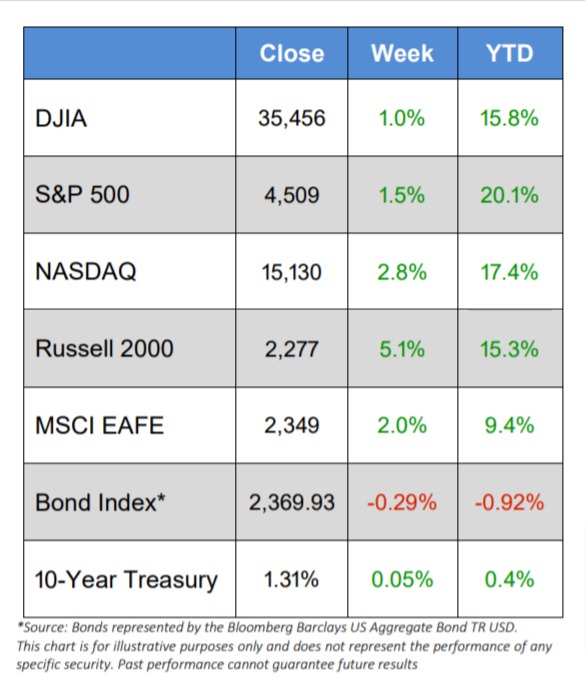
- The major U.S. equity indices all jumped on the week, with the smaller-cap Russell 2000 advancing 5.1% to lead the way
- Not to be outdone, the large-cap S&P 500 (+1.5%) and the tech-laden NASDAQ (+2.8%) both hit new highs every day except Thursday while the DJIA turned in a pedestrian 1.0% gain
- Of the 11 S&P 500 sectors, only 4 were negative, as Utilities (-2.1%), Consumer Staples (-1.4%), Health Care (-1.2%), and Real Estate (-0.3%) all underperformed
- But of the 7 positive S&P 500 sectors, Energy leapt 7.3% and 5 others jumped more than 2%
- Much of the week’s positive action happened on Friday, shortly after the Fed indicated tapering of its monthly bond-buying program might begin sooner rather than later
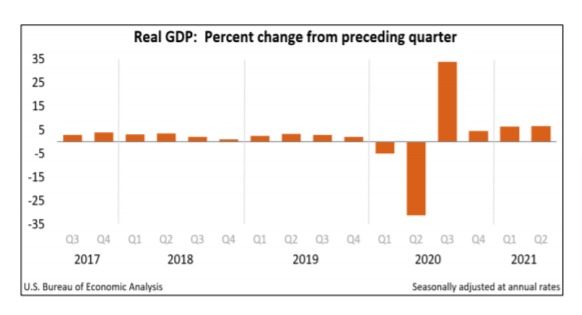
- The second estimate of GDP numbers were reported for the second quarter indicating that the economy grew at a healthy estimate of 6.6%, more than the first quarter’s 6.3%
- WTI Crude added about $6 on the week, as it ended the week just shy of $69/barrel
- The 10-year Treasury yield ended the week at 1.31%
- The U.S. Dollar Index fell 0.9% to 92.68
- Volatility, as measured by the VIX, trended down for the week, although Thursday saw a brief spike
Stocks Advance as Oil Jumps
U.S. stocks advanced on the week, despite geopolitical worries, as the smaller-cap Russell 2000 leapt an astonishing 5.1%. And the larger-cap S&P 500 and techinfused NASDAQ posted gains every day except Thursday, hitting new highs each time, with much of the gains on the last trading day of the week.
The Energy sector reversed its recent trend and leapt over 7% on the week, as oil prices went up about 10% on the week to just under $69/barrel. As is typical this time of year, trading volume was light, as volatility trended downward.
Wall Street seemed happy when the FDA provided full approval of the Pfizer shot, thinking that more employers might mandate vaccines, thereby bringing more people back to work and continuing the recovery. And stock markets appeared to be headed towards 5 days of positive movement until the attack at the Kabul airport in Afghanistan was reported.
The economic data reported this week was generally positive as:
- July existing home sales rose 2% from June
- July new home sales were up 1% from June
- Weekly initial jobless increased slightly
- The Commerce Department announced that second-quarter GDP growth increased by 6.6%, which was slightly higher than the first estimate of 6.5%
Performance in Perspective
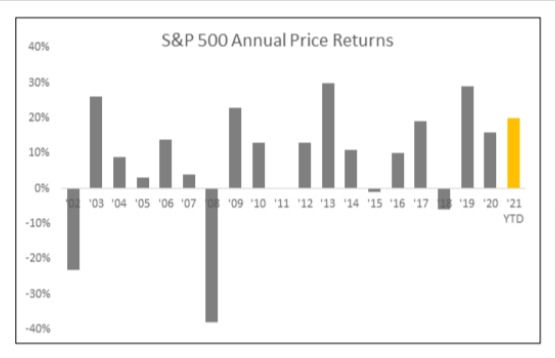
With the S&P 500 hitting new records again this week, it’s important to keep these records in perspective, although that is not so easy as this year alone has seen 50 record closes so far. Further, with the S&P 500 advancing almost 20% so far this year, if the year ended Friday, then 2021 would rank 5th in annual price gains over the past 20 years.
GDP Up 6.6%
On Thursday, the Bureau of Economic Analysis reported that real gross domestic product (GDP) increased at an annual rate of 6.6% in the second quarter of 2021. Relative to the first quarter of the year, our economy grew more in the second three month period – 6.6% versus 6.3%.
Here is an explanation of the recent increase in GDP from the Bureau of Economic Analysis:
“The increase in real GDP in the second quarter reflected increases in personal consumption expenditures (PCE), nonresidential fixed investment, exports, and state and local government spending that were partly offset by decreases in private inventory investment, residential fixed investment, and federal government spending. Imports, which are a subtraction in the calculation of
GDP, increased.
The increase in PCE reflected increases in services (led by food services and accommodations) and goods (led by “other” nondurable goods, notably pharmaceutical products, as well as clothing and footwear). The increase in nonresidential fixed investment reflected increases in intellectual property products (led by research and development as well as software) and equipment (led by transportation equipment). The increase in exports reflected an increase in goods (led by nonautomotive capital goods) and services (led by travel). The decrease in private inventory investment was led by a decrease in retail trade inventories. The decrease in federal government spending primarily reflected a decrease in nondefense spending on intermediate goods and services. In the second quarter, nondefense services decreased as the processing and administration of Paycheck Protection Program loan applications by banks on behalf of the federal government declined.”
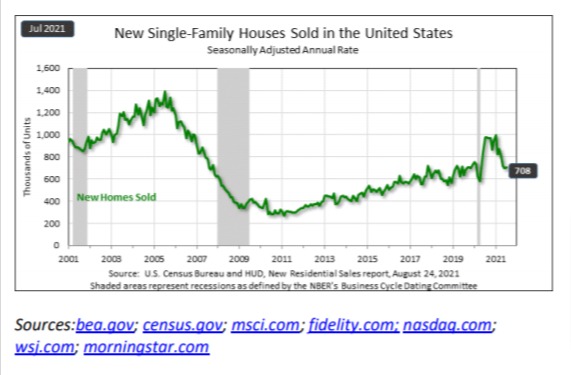
Confusing Housing Data
The U.S. Census Bureau and the U.S. Department of Housing and Urban Development provides a confusing snapshot of the housing industry in its two press releases that were less than a week apart. To summarize: building permits are up, housing starts are down, housing completions are up – and sales of new single-family homes were down a staggering 27.2% relative to this time last year.
Building Permits Were Up in July
- Privately‐owned housing units authorized by building permits in July were 2.6% above the June rate and 6.0% above the July 2020 rate
- Single‐family authorizations in July were 1.7% below the June figure
- Authorizations of units in buildings with five units or more were at a rate of 532,000 in July
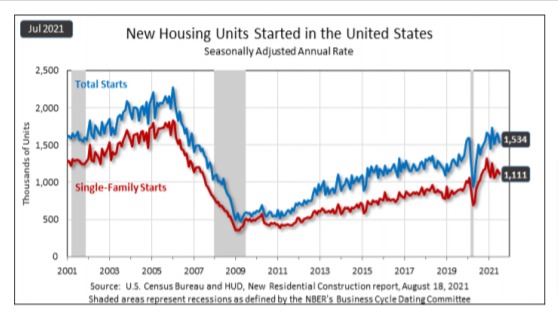
Housing Starts Were Down in July
- Privately‐owned housing starts in July were 7.0% below the June estimate but 2.5% above the July 2020 rate
- Single‐family housing starts in July were 4.5% below the June figure
- The July rate for units in buildings with five units or more was 412,000
Housing Completions Up in July
- Privately‐owned housing completions in July were 5.6% above the June estimate and 3.8% above the July 2020 rate
- Single‐family housing completions in July were 3.6% above the June rate
- The July rate for units in buildings with five units
or more was 426,000
Then on August 24th, it was reported that:
- Sales of new single‐family houses in July 2021 were 1.0% above the June rate but 27.2% below the July 2020 estimate
- The median sales price of new houses sold in July 2021 was $390,500
- The average sales price was $446,000
- The seasonally‐adjusted estimate of new houses for sale at the end of July represents a supply of 6.2 months at the current sales rate