MARKETS RETREAT FROM RECORD HIGHS AS GDP DISAPPOINTS AND THE FED MAINTAINS ITS ACCOMODATIVE POLICIES
- It was a very busy summer week, with lots of earnings reports, economic data, meetings from the Fed, and more COVID worries; but when it was over, markets ended mixed
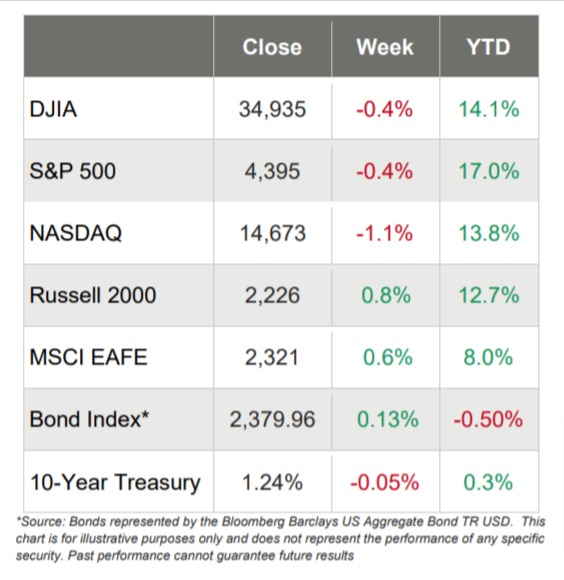
- The S&P 500 (-0.4%), DJIA (-0.4%) and NASDAQ (- 1.1%) all retreated on the week whereas the small cap Russell 2000 added 0.8%
- The big tech names reported this week, with Apple, Microsoft, Google, Facebook and Amazon all reporting decent earnings, but not enough to keep markets afloat, which some take as a worrisome sign given that those five names comprise more than 20% of the S&P 500’s market cap
- Looking at economic data, many eyes were on GDP numbers and those came in lower than expected, as did new home sales
- On the other hand, consumer confidence for July moved up more than expected
- The Fed held some mid-week meetings and as expected, kept its very accommodative policies in place, including leaving the fed funds as is, which most expected to happen
- Seven of the 11 S&P 500 sectors ended up this week, with Materials (+2.8%) and Energy (+1.6%) doing well and Consumer Discretionary (-2.6%) and Communication Services (-1.0%) underperforming
- The 10-year Treasury yield decreased to 1.24%
Markets Retreat from Recent Highs
The major U.S. stock markets were mixed this week, as only the small-cap Russell 2000 advanced modestly. The other three indices all pulled back, but only after hitting record highs at the beginning of the week.
It was a surprisingly busy week with a lot of earnings reports for Wall Street to digest as 177 companies reported, but there was also a slew of economic data too, including GDP numbers which came in lower than consensus expectations. And while the disappointing GDP numbers weighed down markets, so did worries about the spreading delta variant and concerns that there might be more shutdowns that could derail the recovery.
Toward the end of the week, the Bureau of Economic Analysis reported that GDP increased at an annualized rate of 6.5% in the second quarter, which was considerably less the 8.5% expected by experts. Yes, it was the second fastest growth number since 2003, but underlying supply chain issues appear to be dampening growth.
In addition to GDP numbers, investors heard that:
- June durable goods orders fell short of expectations
- Core capital goods orders and shipments fell
- Weekly jobless claims fell less than expected
- July consumer confidence rose more than expected
- Personal spending increased more than expected
GDP Growth Less Robust Versus Expectations
On Thursday, the Bureau of Economic Analysis reported that real gross domestic product increased at an annual rate of 6.5% in the second quarter of 2021. For perspective, in the first quarter, real GDP increased 6.3%.
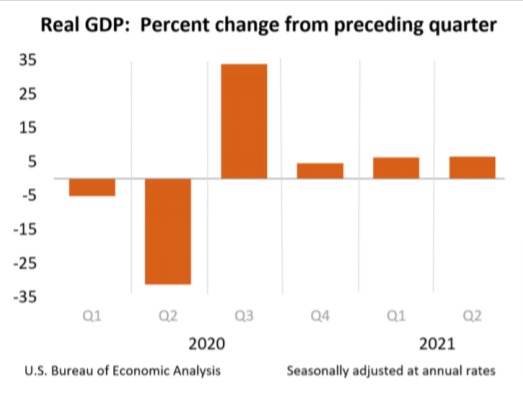
The increase in real GDP in the second quarter reflected increases in:
- Personal consumption expenditures;
- Nonresidential fixed investment;
- Exports; and
- State and local government spending.
And there were decreases in:
- Private inventory investment
- Residential fixed investment; and
- Federal government spending.
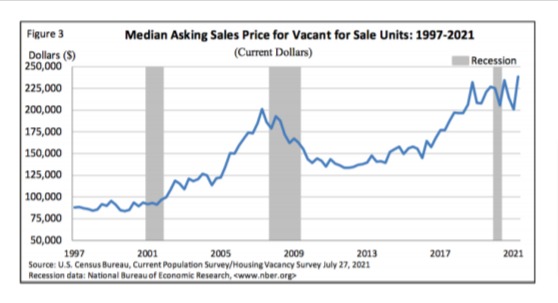
Frothy Housing Market?
On Tuesday, the U.S. Census Bureau announced residential vacancies and homeownership statistics for the second quarter of 2021 and the data reflected what some might interpret as a frothy housing market, especially when viewed through the lens of the last 20+ years.
From the release:
- National vacancy rates in the second quarter 2021 were 6.2% for rental housing and 0.9% for homeowner housing
- The rental vacancy rate was 0.5 percentage points higher than the rate in the second quarter 2020 (5.7%) and 0.6 percentage points lower than the rate in the first quarter 2021 (6.8%)
- The homeowner vacancy rate of 0.9% was the same as the rate in the second quarter 2020 and the first quarter 2021 (0.9%)
- The homeownership rate of 65.4% was 2.5 percentage points lower than the rate in the second quarter 2020 (67.9%) and not statistically different from the rate in the first quarter 2021 (65.6%)
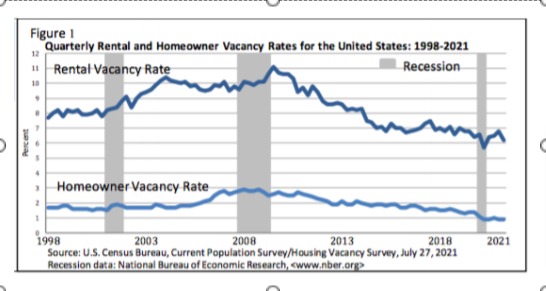
- The homeowner vacancy rate in the South (1.0%) was higher than the rate in the Midwest (0.7%), the Northeast (0.9%) and the West (0.8%). There were no other statistically significant differences between the regions. The rates in all regions were not statistically different from the second quarter 2020 rates
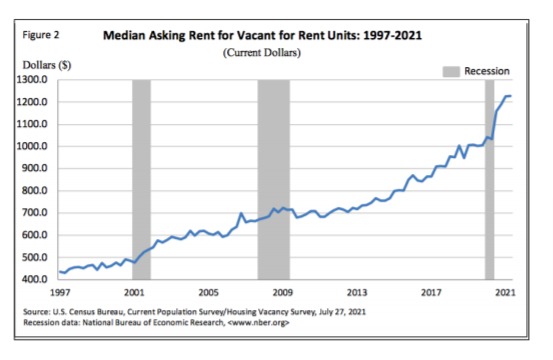
- The rental vacancy rate was lowest in the West (4.8%), followed by the Northeast (5.6%), South (6.9%) and Midwest (7.3%) In the second quarter 2021, the median asking rent for vacant for rent units was $1,228.
In the second quarter 2021, the median asking sales price for vacant for sale units was $238,600.