MARKETS MIXED THIS WEEK AS INFLATION CONTINUES TO RISE AND SMALL BUSINESSES STRUGGLE TO FIND EMPLOYEES
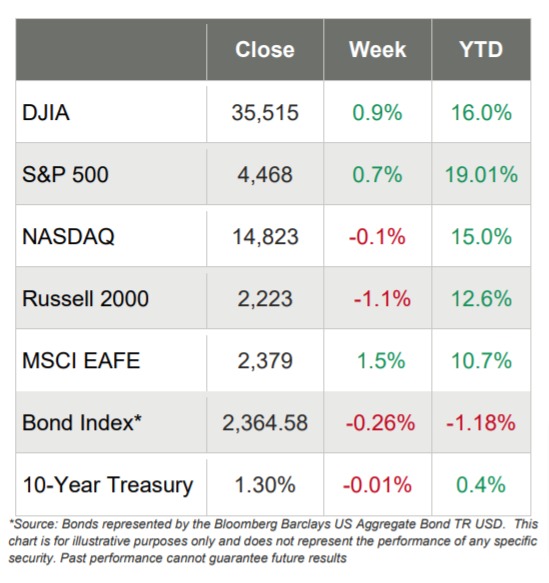
- Large-cap U.S. markets hit fresh new highs this week, with the DJIA gaining 0.9% and the S&P 500 advancing 0.7%
- The tech-laden NASDAQ and smaller cap Russell 2000, on the other hand, retreated 0.1% and 1.1%, respectively
- Much of Wall Street was focused on Washington, where a $1.2 trillion infrastructure bill was passed and discussions regarding another $2+ trillion are ongoing
- Almost all of the S&P 500 sectors advanced, with only the Energy sector (-0.8%) losing ground
- Of the ten positive sectors, Materials made a big jump and gained 2.7% while Consumer Staples moved up more than 2% too
- There was a lot of economic data this week, including a lot of data that pointed to inflation continuing, although many in the media were quick to conclude that inflation was retreating
- Small businesses reported that job openings hit an almost five-decade high
- Inflation numbers as measured by the Consumer Price Index came in up again, as they have for every month so far in 2021
- Producer Price Index jumped 1%, the same as the previous month
- The University of Michigan Sentiment Survey for August showed a big surprise, as it fell to 70.2 from 81.2, its lowest level since 2011
- The 10-year Treasury yield barely moved on the week, dropping 1 basis point to end the week at 1.30%
Markets Mixed, but Large-Caps Hit New Highs Again
U.S. stock markets were mixed this week, but both the S&P 500 and the DJIA were able to squeeze out modest gains on their way to new record highs. Unfortunately, the small-cap Russell 2000 and the tech laden NASDAQ went the other way, underperforming their larger-cap counterparts.
Within the S&P 500 Index, value stocks outperformed the growth names and the larger-caps outperformed the smaller names. The good news is that 10 of the 11 S&P 500 sectors advanced, with just the Energy sector pulling back on worries that the new delta variant might drag down global demand.
Wall Street was anxious to receive CPI numbers this week, and the 0.5% increase in July was considered positive, as it was less than the previous month and less than expected, fueling the notion that inflation will be more transitory versus permanent. But a glass-half empty economist would be quick to point out that inflation has risen every month so far in 2021.
Then the day after CPI data was released, it was reported that the PPI Index (that measures the costs from the perspective of businesses) jumped 1% for the second consecutive month and well ahead of expectations. Further, year-over-year producer prices were up 7.8%, the highest 12-month rate since the data were first calculated in November 2010.
In addition, Wall Street received this economic data too:
- Small businesses are struggling to find employees as the number of job openings hit a 48 year high
- Small business optimism declined
- Initial jobless claims fell 12,000 to 375,000
- Consumer Sentiment dropped significantly
Consumer Price Index Up in July
On Wednesday, Wall Street was eagerly anticipating Consumer Price Index data from the Bureau of Labor Statistics to see the extent of inflation.
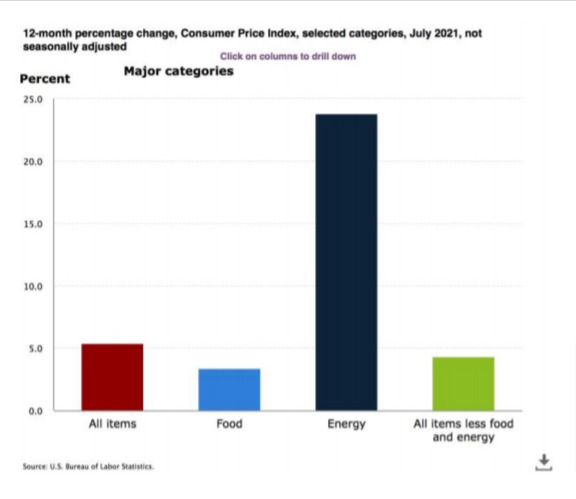
And when markets opened, it the BLS reported that the Consumer Price Index increased 5.4% over the past 12 months. Surprisingly, media outlets ran with headlines like these: “Inflation is Not as Bad as Feared” and “Inflation Fears Moderate” and even this one: “Core Inflation Starts to Ease.”
And while it’s technically true that inflation “only” rose 0.5% in July after rising 0.9% in June – and having risen every month so far in 2021 – keep in mind that an increase of 0.5% every month is going to bring annual inflation north of 6%.
Here are a few of the more troublesome inflation numbers – over the past 12 months:
- Energy is up over 23%;
- Fuel oil is up over 39%; and
- Used cars and trucks are up over 41%
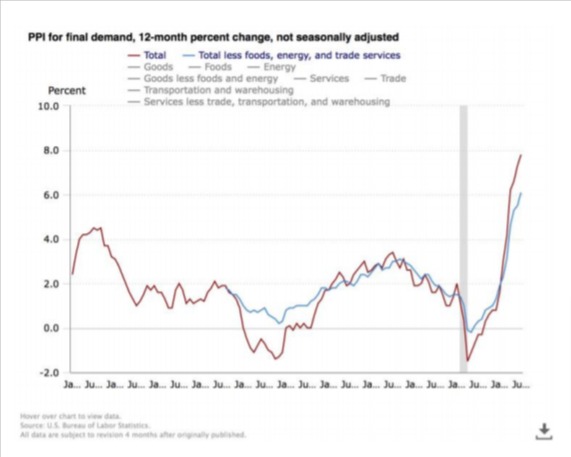
Producer Price Index Jumps 1%
Keeping with the inflation theme, on Thursday, the BLS reported that the Producer Price Index increased 1.0% in July, after moving up 1% in June and 0.8% in May. Maybe more startling was the fact that the final demand index moved up 7.8% for the 12 months ended in July, the largest advance since 12-month data were first calculated in November 2010.
Further:
- Nearly three-fourths of the July increase in the final
demand index can be traced to a 1.1% advance in
prices for final demand services.
- The index for final demand goods rose 0.6%
- Prices for final demand less foods, energy, and trade services moved up 0.9% in July, the largest advance since climbing 1.0% in January
- For the 12 months ended in July, the index for final demand less foods, energy, and trade services rose 6.1%, the largest increase since 12-month data were first calculated in August 2014
Unfilled Job Openings Hit a 48-Year Record High as Small Businesses are Feeling Less Optimistic
On Tuesday, the National Federation of Independent Businesses reported that “the NFIB Small Business Optimism Index decreased in July to 99.7, a decrease of 2.8 points, reversing June’s 2.9-point gain. Six of the 10 components declined, three improved, and one was unchanged. The NFIB Uncertainty Index decreased seven points to 76, indicating owners’ views are held with more certainty than in earlier months.
Other key findings include:
- Sales expectations over the next three months decreased 11 points to a net negative 4% of owners.
- Owners expecting better business conditions over the next six months decreased eight points to a net negative 20%.
- Earnings trends over the past three months decreased eight points to a net negative 13%.
As reported in the NFIB’s monthly jobs report, 49% of owners reported job openings that could not be filled, a 48- year record high. Owners’ plans to fill open positions remain at record high levels, with a seasonally adjusted net 27% planning to create new jobs in the next three months, down one point from June’s record high reading.”
More Inflation Worries
While there are lots of data points that can lead to declining optimism, inflation is one of them as the NFIB’s report found that:
- 46% of owners (seasonally adjusted) reported raising average selling prices.
- 52% of owners reported raising average selling prices, two points higher than June. Price increases in wholesale and retail trades posted significant declines. The largest increases in price raising activity were in the non-professional services and transportation.
- Price hikes were the most frequent in wholesale (73% higher, 0% lower), manufacturing (61% higher, 6% lower), and retail (57% higher, 7% lower).
- Seasonally adjusted, 44% plan price hikes.
Maybe a silver lining (depending on your perspective of course) is the fact that a net 38% of owners (seasonally adjusted) reported raising compensation, down one point from June’s record high of 39%.
Plus, a net 27% plan to raise compensation in the next three months, up one point from June and a 48 year record high reading.


