MARKETS UP AS CONSUMER CONFIDENCE AND EXPECTATIONS HIT RECORD HIGHS AND MANUFACTURING ACTIVITY JUMPS
- It was a good week for U.S. stock markets, as all of the major U.S. equity indices moved up on the trade-shortened week
- NASDAQ was the clear winner with a gain of 2.6%, but the 1.1% gain for the S&P 500 garnered just as much excitement as it crested the purely psychological 4,000-point barrier for the first time.
- The mega-cap DJIA inched up 0.2% and the smallercap Russell 2000 rose 1.5%
- The week started with a worrisome tone as it was announced that Archegos Capital Management as defaulting on margin calls and selling more than $20 billion in stock
- But surprisingly, the Archegos issue did not spill over into the markets as much as some anticipated and the markets resumed their march forward as the month- and quarter-end came to a close on Wednesday
- Of the S&P 500 sectors, Communication Services had a big week as it rose 3.4%, while Consumer Discretionary (+2.2%) and Information Technology (+2.1%) also performed well
- Unfortunately, 4 of the 11 sectors ended the week lower, with Energy, Materials, Health Care and Consumer Staples all losing just under 1%
- Much of the news was focused on President Biden’s proposed $2.3 trillion infrastructure plan and news that there would be another stimulus bill proposed soon
- The 10-year Treasury yield was quiet this week as it increased just 2 basis points to 1.68%

Good Week for U.S. Stocks as S&P 500 Passes 4,000
Markets were closed Friday in observance of the Good Friday holiday, but the 4 days of trading was plenty to push the benchmarks higher for the week. While NASDAQ returned to its perch of leading the other indices with a gain of 2.6%, it was the large-cap S&P 500 that garnered most of the news as it crossed the purely-psychological 4,000-point barrier for the first time.
The Energy, Materials, Health Care and Consumer Staples all underperformed on the week, losing less than 1%. But in a reversal of the past few weeks and consistent with most of 2020, the Information Technology sector regained the top perch among the 11 sectors.
The week’s economic data was mostly received positively by Wall Street:
- On Tuesday, the Conference Board announced that its index of consumer confidence recorded its biggest gain in almost 18 years and its gauge of consumer expectations reached its best level since the summer of 2019
- Regional manufacturing indexes surpassed expectations, with the Institute for Supply Management’s gauge of factory activity reaching its highest level since December 1983
- On Thursday, the Labor Department announced that weekly jobless claims moved up to 719,000
On Wednesday, Wall Street closed the books on the month of March and the first quarter of 2021 and many are suggesting that the week’s advancements were the result of profit-taking and rebalancing. Whether or not that’s true is hard to discern, but a quick recap of the monthly performance for March is warranted.
Markets Mostly Up in March
Global equity markets were generally up for the month of March, but like February, it was an uneven ride. For the month of March:
- The DJIA was up 6.6%;
- The S&P 500 was also up 6.6%;
- NASDAQ was up 0.4%; and
- The Russell 2000 was down 2.4%.
Interestingly, the DJIA’s 6+ percentage-point outperformance relative to NASDAQ represented the biggest monthly spread between the two indices since February 2002, according to Dow Jones Market Data. It is especially notable that the DJIA, which has existed for almost 125 years, has outpaced NASDAQ by this much in a month only 19 other times since the NASDAQ index was launched. And that was 1971.
Market Performance Around the World
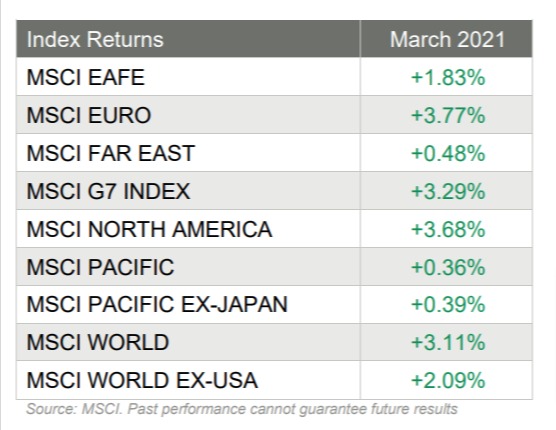
Investors looking outside our borders performed very well, as all 35 developed markets tracked by MSCI were positive for the month of March, as they were in February. And of the 35 positive MSCI indices, the MSCI Euro led the way with a gain of 3.77% for the month. Interestingly, of the 40 developing markets tracked by MSCI, 28 of those were positive in March too.

Unprecedented Growth in Housing
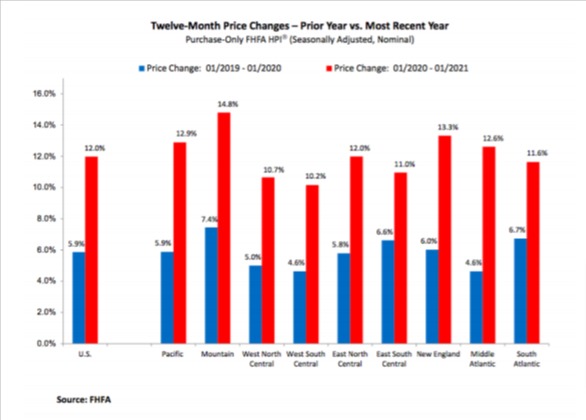
On Tuesday, the Federal Housing Finance Agency announced that house prices rose nationwide in January, up 1.0% from the previous month, and up 12% from January 2020 to January 2021.
Further, “for the nine census divisions, seasonally adjusted monthly house price changes from December 2020 to January 2021 ranged from -0.2 percent in the East South Central division to +1.5 percent in the Mountain division. The 12-month changes ranged from +10.2 percent in the West South Central division to +14.8 percent in the Mountain division.“
Other categories showed steep declines, including:

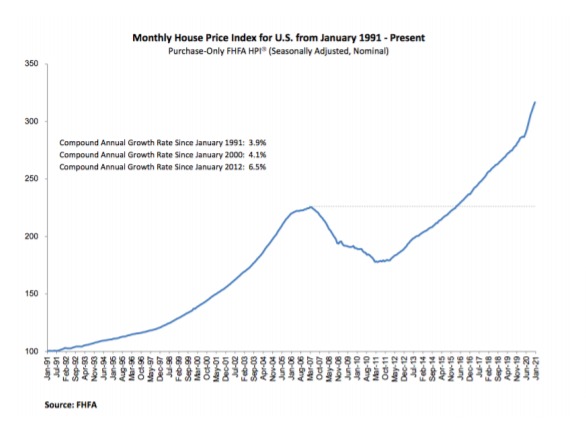
While this data was compiled before February’s spike in mortgage rates, it is still the eighth straight monthly gain of 1% or more, which is unprecedented. Further, the year-overyear appreciation of 12% is also a record going back over 30 years.


