The week in review
- PCE inflation +1.8% y/y
- U.S. household income +21.1% m/m
The week ahead
- ISM Manufacturing PMI
- Unemployment rate
Thought of the week
The U.S. economy, as measured by real GDP, accelerated in 1Q21, recording an annualized increase of 6.4%. Almost a year removed from the 2Q20 contraction of -31.4%, it is clear that the economy is in themidst of a swift, consumer-driven recovery; this latest reading is the third consecutive quarter of above-trend growth, following strong GDP prints in 3Q20 (+33.4%) and 4Q20 (+4.3%). Under the hood, 1Q21 personal consumption expenditures rose at a SAAR of 10.7% with the goods and services components up 23.6% and 4.6%, respectively. Strength in the services sector was driven by increasing vaccinations and gradual return to normalcy, as evidenced by solid q/q growth in air transportation (+11.5%), accommodations (+9.5%) and food services (+5.8%). Recent market performance has also been stellar, with the S&P 500 and NASDAQ indices hitting record highs last week on the back of a blowout 1Q earnings season. The quick rebound in the U.S. economy and equity market has directed increased attention to the Fed.
For now, the Fed remains accommodative, electing at the most recent FOMC meeting to once again not adjust the target federal funds rate and reaffirming its commitment to asset purchases until “substantial further progress is made.” However, Chair Powell did highlight the vaccination campaign and fiscal stimulus as the primary drivers of the recovery and even noted improvements in the sectors hardest hit by the pandemic. As a result, with the backdrop of a robust recovery, investors should be positioned for higher yields as strong growth and higher inflation are realized in the quarters to come.
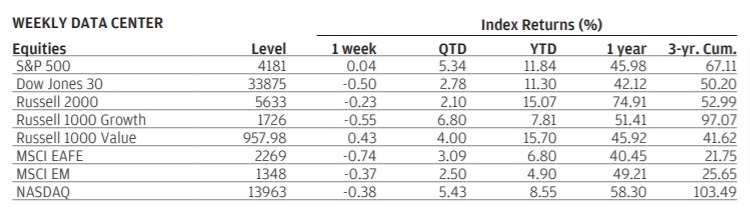

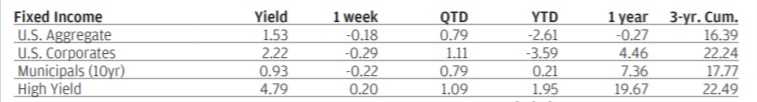
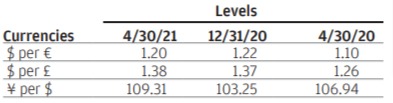
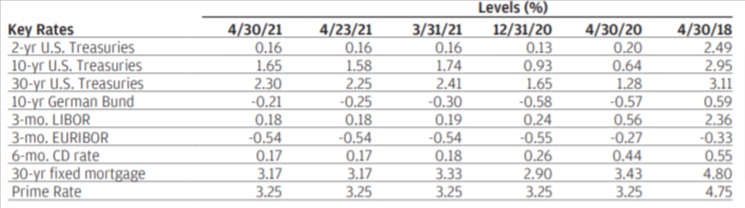

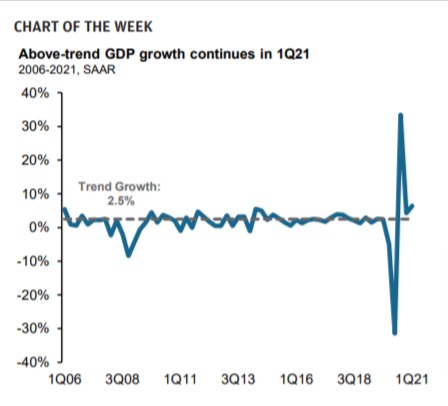
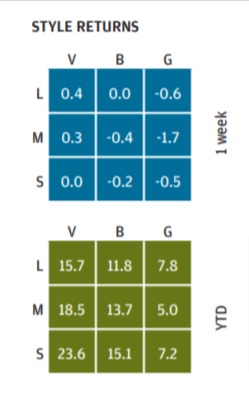
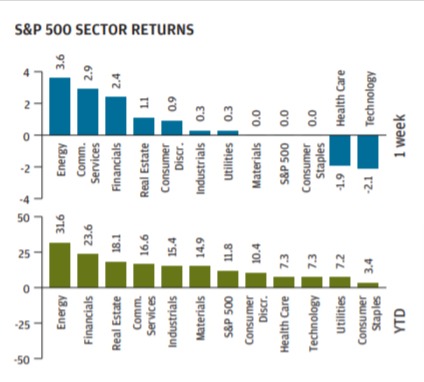
Chart of the Week: Source: BEA, J.P. Morgan Asset Management. Data are as of April 30, 2021
Thought of the week: Source: BEA, J.P. Morgan Asset Management. Data are as of April 30, 2021
Abbreviations: Cons. Sent.: University of Michigan Consumer Sentiment Index; CPI: Consumer Price Index; EIA: Energy Information Agency; FHFA HPI: – Federal Housing Finance Authority House Price Index; FOMC: Federal Open Market Committee; GDP: gross domestic product; HPI: Home Price Index; HMI: Housing Market Index; ISM Mfg. Index: Institute for Supply Management Manufacturing Index; PCE: Personal consumption expenditures; Philly Fed Survey: Philadelphia Fed Business Outlook Survey; PMI: Purchasing Managers’ Manufacturing Index; PPI: Producer Price Index; SAAR: Seasonally Adjusted Annual Rate.
Equity Price Levels and Returns: All returns represent total return for stated period. Index: S&P 500; provided by: Standard & Poor’s. Index: Dow Jones Industrial 30 (The Dow Jones is a price-weighted index composing of 30 widelytraded blue chip stocks.) ; provided by: S&P Dow Jones Indices LLC. Index: Russell 2000; provided by: Russell Investments. Index: Russell 1000 Growth; provided by: Russell Investments. Index: Russell 1000 Value; provided by: Russell Investments. Index: MSCI – EAFE; provided by: MSCI – gross official pricing. Index: MSCI – EM; provided by: MSCI – gross official pricing. Index: Nasdaq Composite; provided by: NASDAQ OMX Group.
MSCI EAFE is a Morgan Stanley Capital International Index that is designed to measure the performance of the developed stock markets of Europe, Australasia, and the Far East.
Bond Returns: All returns represent total return. Index: Barclays US Aggregate; provided by: Barclays Capital. Index: Barclays Investment Grade Credit; provided by: Barclays Capital. Index: Barclays Municipal Bond 10 Yr; provided by: Barclays Capital. Index: Barclays Capital High Yield Index; provided by: Barclays Capital.
Key Interest Rates: 2 Year Treasury, FactSet; 10 Year Treasury, FactSet; 30 Year Treasury, FactSet; 10 Year German Bund, FactSet. 3 Month LIBOR, British Bankers’ Association; 3 Month EURIBOR, European Banking Federation; 6 Month CD, Federal Reserve; 30 Year Mortgage, Mortgage Bankers Association (MBA); Prime Rate: Federal Reserve.
Commodities: Gold, FactSet; Crude Oil (WTI), FactSet; Gasoline, FactSet; Natural Gas, FactSet; Silver, FactSet; Copper, FactSet; Corn, FactSet. Bloomberg Commodity Index (BBG Idx), Bloomberg Finance L.P.
Currency: Dollar per Pound, FactSet; Dollar per Euro, FactSet; Yen per Dollar, FactSet
S&P Index Characteristics: Dividend yield provided by FactSet Pricing database. Fwd. P/E is a bottom-up weighted harmonic average using First Call Mean estimates for the “Next 12 Months” (NTM) period. Market cap is a bottom-up weighted average based on share information from Compustat and price information from FactSet’s Pricing database as provided by Standard & Poor’s.
MSCI Index Characteristics: Dividend yield provided by FactSet Pricing database. Fwd. P/E is a bottom-up weighted harmonic average for the “Next 12 Months” (NTM) period. Market cap is a bottom- up weighted average based on share information from MSCI and Price information from FactSet’s Pricing database as provided by MSCI.
Russell 1000 Value Index, Russell 1000 Growth Index, and Russell 2000 Index Characteristics: Trailing P/E is provided directly by Russell. Fwd. P/E is a bottom-up weighted harmonic average using First Call Mean estimates for the “Next 12 Months” (NTM) period. Market cap is a bottom-up weighted average based on share information from Compustat and price information from FactSet’s Pricing database as provided by Russell.
Sector Returns: Sectors are based on the GICS methodology. Return data are calculated by FactSet using constituents and weights as provided by Standard & Poor’s. Returns are cumulative total return for stated period, including reinvestment of dividends.
Style Returns: Style box returns based on Russell Indexes with the exception of the Large-Cap Blend box, which reflects the S&P 500 Index. All values are cumulative total return for stated period including the reinvestment of dividends. The Index used from L to R, top to bottom are: Russell 1000 Value Index (Measures the performance of those Russell 1000 companies with lower price-to-book ratios and lower forecasted growth values), S&P 500 Index (Index represents the 500 Large Cap portion of the stock market, and is comprised of 500 stocks as selected by the S&P Index Committee), Russell 1000 Growth Index (Measures the performance of those Russell 1000 companies with higher price-to-book ratios and higher forecasted growth values), Russell Mid Cap Value Index (Measures the performance of those Russell Mid Cap companies with lower price-to-book ratios and lower forecasted growth values), Russell Mid Cap Index (The Russell Midcap Index includes the smallest 800 securities in the Russell 1000), Russell Mid Cap Growth Index (Measures the performance of those Russell Mid Cap companies with higher price-to-book ratios and higher forecasted growth values), Russell 2000 Value Index (Measures the performance of those Russell 2000 companies with lower price-to-book ratios and lower forecasted growth values), Russell 2000 Index (The Russell 2000 includes the smallest 2000 securities in the Russell 3000), Russell 2000 Growth Index (Measures the performance of those Russell 2000 companies with higher priceto-book ratios and higher forecasted growth values).
Past performance does not guarantee future results.
Diversification does not guarantee investment returns and does not eliminate the risk of loss
Opinions and estimates offered constitute our judgment and are subject to change without notice, as are statements of financial market trends, which are based on current market conditions. We believe the information provided here is reliable, but do not warrant its accuracy or completeness. This material is not intended as an offer or solicitation for the purchase or sale of any financial instrument. The views and strategies described may not be appropriate for all investors. This material has been prepared for informational purposes only, and is not intended to provide, and should not be relied on for, accounting, legal or tax advice. References to future returns are not promises or even estimates of actual returns a client portfolio may achieve. Any forecasts contained herein are for illustrative purposes only and are not to be relied upon as advice or interpreted as a recommendation.
The Market Insights program provides comprehensive data and commentary on global markets without reference to products. Designed as a tool to help clients understand the markets and support investment decision-making, the program explores the implications of current economic data and changing market conditions.
The J.P. Morgan Asset Management Market Insights and Portfolio Insights programs, as non-independent research, have not been prepared in accordance with legal requirements designed to promote the independence of investment research, nor are they subject to any prohibition on dealing ahead of the dissemination of investment research.
This document is a general communication being provided for informational purposes only. It is educational in nature and not designed to be taken as advice or a recommendation for any specific investment product, strategy, plan feature or other purpose in any jurisdiction, nor is it a commitment from J.P. Morgan Asset Management or any of its subsidiaries to participate in any of the transactions mentioned herein. Any examples used are generic, hypothetical and for illustration purposes only. This material does not contain sufficient information to support an investment decision and it should not be relied upon by you in evaluating the merits of investing in any securities or products. In addition, users should make an independent assessment of the legal, regulatory, tax, credit, and accounting implications and determine, together with their own financial professional, if any investment mentioned herein is believed to be appropriate to their personal goals. Investors should ensure that they obtain all available relevant information before making any investment. Any forecasts, figures, opinions or investment techniques and strategies set out are for information purposes only, based on certain assumptions and current market conditions and are subject to change without prior notice. All information presented herein is considered to be accurate at the time of production, but no warranty of accuracy is given and no liability in respect of any error or omission is accepted. It should be noted that investment involves risks, the value of investments and the income from them may fluctuate in accordance with market conditions and taxation agreements and investors may not get back the full amount invested. Both past performance and yields are not reliable indicators of current and future results.
J.P. Morgan Asset Management is the brand for the asset management business of JPMorgan Chase & Co. and its affiliates worldwide.
Telephone calls and electronic communications may be monitored and/or recorded.
Personal data will be collected, stored and processed by J.P. Morgan Asset Management in accordance with our privacy policies at https://www.jpmorgan.com/privacy.
This communication is issued in the United States, by J.P. Morgan Investment Management Inc. or J.P. Morgan Alternative Asset Management, Inc., both regulated by the Securities and Exchange Commission.
If you are a person with a disability and need additional support in viewing the material, please call us at 1-800-343 1113 for assistance.
Copyright 2021 JPMorgan Chase & Co. All rights reserved.
©JPMorgan Chase & Co., May 2021.
Unless otherwise stated, all data is as of May 3, 2021 or as of most recently available.
0903c02a81dbac80


