MARKETS MIXED AS WALL STREET GRAPPLES WITH INFLATION AND GENERALLY BETTER-THAN-EXPECTED ECONOMIC DATA
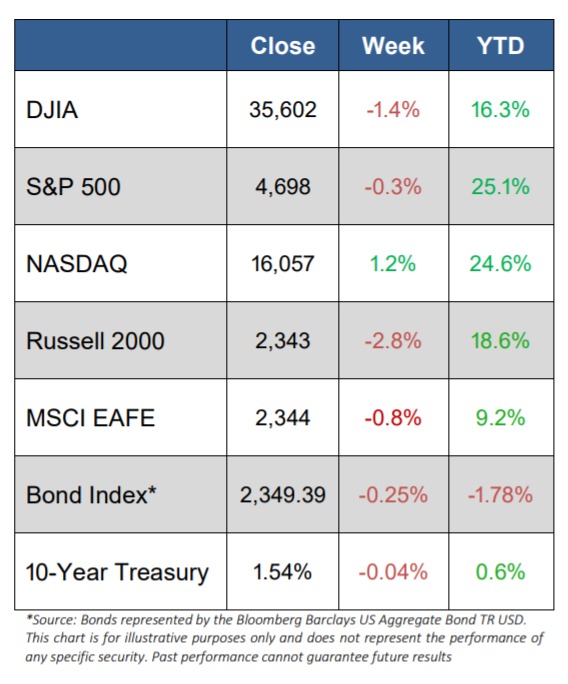
- U.S. equity markets turned in a mixed week, with the mega-cap DJIA (-1.4%) and the smaller-cap Russell 2000 (-2.8%) book-ending the large-cap S&P 500 (+0.3%) and the technology-heavy NASDAQ (+1.2%)
- Inflation continued to weigh on investors’ minds, but the S&P 500 and NASDAQ decided
to set closing highs this week nonetheless
- Looking at the 11 S&P 500 sectors, only 3 of the 11 ended the week higher, with Consumer Discretionary (+3.8%), Information Technology (+2.4%), and Utilities (+0.9%) outperforming the others
- Of the sectors that retreated, Energy (-5.2%), Financials (-2.8%), and Materials (-2.0%) were hit harder than most
- Pushing the Energy sector so far down was that oil prices fell about 6% as worries about lighter demand and increased supply turned the table on what had been a pretty good bull market for oil so far in 2021
- Wall Street digested a lot of economic data too, and much of it was ahead of expectations, including retail sales, industrial production, housing and jobless claims
- President Biden signed the $1.2 trillion infrastructure bill and the House passed the $1.75 trillion Build Back Better Act
- The 10-year Treasury yield declined to 1.54%
- The U.S. Dollar Index rose 1.0% to 96.03
Markets Mixed On the Week
The major U.S. equity indices ended the week mixed as Wall Street grappled with inflation worries and supply constraints on the one hand and decently strong economic data and earnings reports on the other.
Growth stocks once again trounced value stocks, helping push NASDAQ and the S&P 500 to new record highs. And interestingly, the range of returns within the S&P 500 sectors was wide, as Consumer Discretionary jumped almost 4% and Energy lost more than 5%.
The Energy sector took it on the chin as oil prices retreated more than 6% after the notion of releasing the strategic reserves in the U.S. seemed to gain momentum.
In other economic news:
- The New York Fed’s Empire State index for November jumped 11.1 points to 30.9, well above expectations
- Starts of new homes fell 0.7%, well below expectations
- Building permits rose 4.0% in October, better than expected
- Initial jobless claims in the November 13 week moved down to 268,000
- The general business conditions index in the Philadelphia Fed’s manufacturing survey rose to 39.0 in November after 23.8 in October, well above expectations
Stocks around the world were mixed too, as:
- The pan-European STOXX Europe 600 Index ended 0.14% lower
- Germany’s Xetra DAX Index gained 0.41%
- France’s CAC 40 Index added 0.29%
- Italy’s FTSE MIB Index lost 1.42%
- The UK’s FTSE 100 Index dropped 1.69%
- Japan’s Nikkei 225 Index rose 0.46%
- Japan’s TOPIX Index rose 0.19%
- China’s CSI 300 Index closed unchanged
- China’s Shanghai Composite Index rose 0.5%
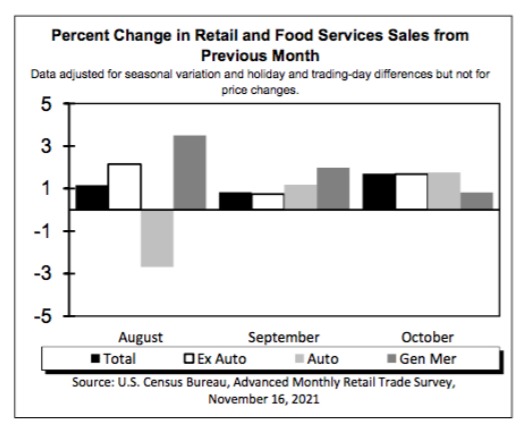
Retail and Food Services Up
On November 16th, the Census Bureau reported that advance estimates of U.S. retail and food services sales for October 2021 were $638.2 billion, an increase of 1.7% from the previous month and 16.3% above October 2020.
- Total sales for the August 2021 through October 2021 period were up 15.4% from the same period a year ago.
- The August 2021 to September 2021 percent change was revised from up 0.7% to up 0.8%.
- Retail trade sales were up 1.9% from September 202 and up 14.8% above last year.
- Gasoline stations were up 46.8% from October 2020, while food services and drinking places were up 29.3 % from last year.
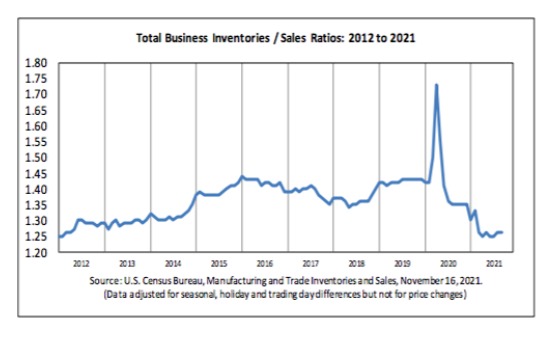
Business Inventories Up
On the same day that the Retail Sales report was released, the Census Bureau reported that the combined value of distributive trade sales and manufacturers’ shipments for September was estimated at $1,669.7 billion, up 0.9% from August 2021 and up 15.5% from September 2020.
- Manufacturers’ and trade inventories for September were up 0.7% from August 2021 and were up 7.5% from September 2020.
- The total business inventories/sales ratio based on seasonally adjusted data at the end of September was 1.26. The September 2020 ratio was 1.35.
Housing Mixed
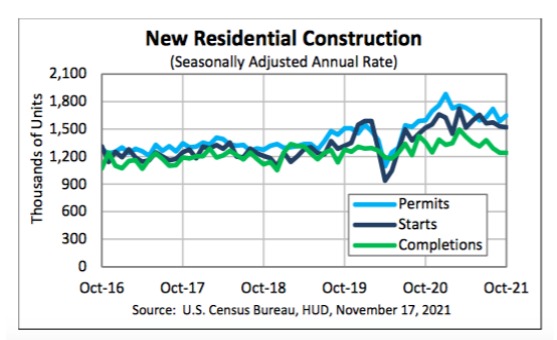
On November 17th, the U.S. Census Bureau and the U.S. Department of Housing and Urban Development jointly announced the following new residential construction statistics for October 2021:
- Privately‐owned housing units authorized by building permits in October were 4.0% above the September rate and 3.4% above the October 2020 rate
- Privately‐owned housing starts in October were 0.7% below September but 0.4% above the October 2020 rate
- Privately‐owned housing completions in October were virtually unchanged from September but were 8.4% below the October 2020 rate