MARKETS LEAP AS THE ISM INDEX OF SERVICE SECTOR ACTIVITY LEAPS TO A NEW RECORD AND INFLATION CREEPS BACK UP
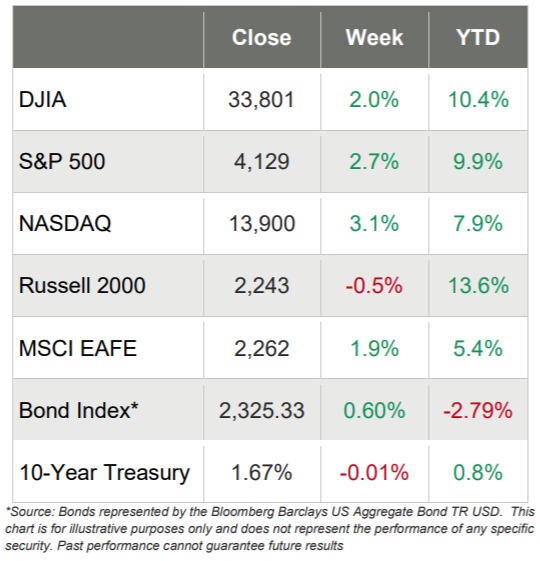
- The large-cap U.S. equity markets had a fantastic week, as NASDAQ leapt 3.1%, the S&P 500 jumped 2.7% and the DJIA advanced 2.0%
- The smaller-cap Russell 2000 underperformed on the week with a 0.5% decline
- Ten of the 11 S&P 500 sectors ended the week painted green and the Information Technology and Consumer Discretionary both jumped over 4%
- The Energy sector was the only one painted red, as it dropped 4.1%
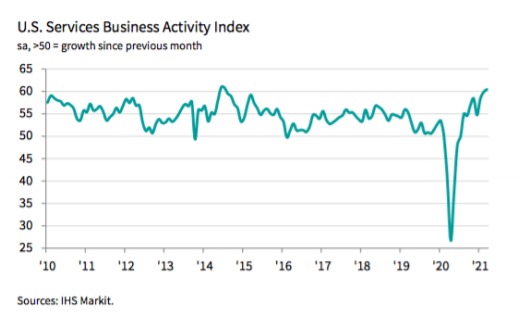
- The week kicked off with a bang, with the ISM Non-Manufacturing Index setting a record
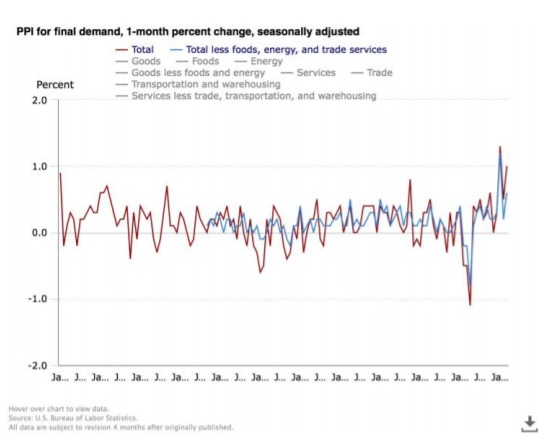
- But the week was book-ended by some not-sogreat news, as the Producer Price Index moved up 1% in March and over 4% year-over-year, worrying some that inflation was more than back
- Initial jobless claims came in worse than expected and the four-week moving average snapped its 8-week declining streak
- West Texas Intermediate Crude trended down most of the week, coming to rest at just under $60/barrel
- The 10-year U.S. Treasury yield trended down slightly and ended the week at 1.67%

Big Week for U.S. Stocks
The larger-cap U.S equity benchmarks marched steadily to new record highs this week as the smaller-cap Russell 2000 ended the week with a small loss. NASDAQ was once again the best performer on the week, as it moved up over 3%, but the DJIA and S&P 500 each recorded gains of over 2% too.
In a redo of most of last year, the Information Technology sector led the way with a gain of almost 5% while the Energy sector was by far the worst sector, turning in a loss of more than 4% on the week. Also as occurred most of last year, Growth stocks handily outperformed Value stocks.
The week’s economic data was somewhat negative this week, with a few glimmers of sunshine mixed in:
- Producer prices surged 1.0% in March to double consensus estimates. The year-over-year rate rose 1.4% to 4.2% for a nearly 10-year high
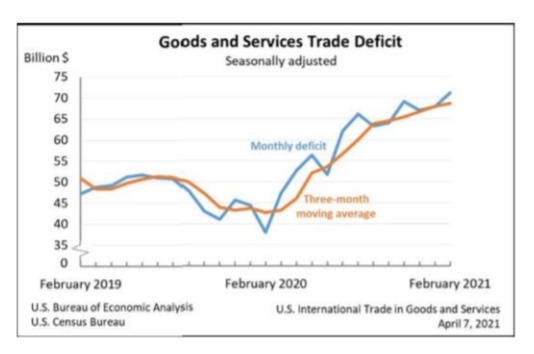
- The US trade deficit continues to deepen significantly, to $71.1 billion in February which is $700 million worse than consensus
- Fastest rise in business activity since the summer of 2014
- Initial jobless claims unexpectedly increased 16,000 in the week ended April 3, topping the consensus forecast of 680,000
- The 4-week average rose to 723,750 from 721,250 the previous week, ending an 8-week declining streak.
Inflation on the Rise
On Friday, the U.S. Bureau of Labor Statistics reported that the Producer Price Index for final demand increased 1.0% in March, and final demand prices rose 0.5% in February and 1.3% in January.

On an unadjusted basis, the final demand index moved up 4.2% for the 12 months ended in March, the largest advance since rising 4.5% for the 12 months ended September 2011. Further, the BLS reports that:
“In March, almost 60 percent of the increase in the index for final demand can be traced to a 1.7 percent advance in prices for final demand goods. The index for final demand services moved up 0.7 percent.
Final demand goods: Prices for final demand goods rose 1.7 percent in March, the largest increase since the index began in December 2009. Sixty percent of the broad-based advance in March is attributable to prices for final demand energy, which jumped 5.9 percent. The indexes for final demand goods less foods and energy and for final demand foods moved up 0.9 percent and 0.5 percent, respectively.
Product detail: Over one-fourth of the March increase in the index for final demand goods can be traced to an 8.8- percent jump in gasoline prices. The indexes for diesel fuel, residential electric power, industrial chemicals, steel mill products, and processed poultry also moved higher. In contrast, beef and veal prices fell 4.3 percent. The indexes for fresh and dry vegetables and for surgical and medical instruments also declined.”
Deficit Jumps $3.3 Billion
The U.S. Census Bureau and the U.S. Bureau of Economic Analysis announced that the goods and services deficit was $71.1 billion in February, up $3.3 billion from $67.8 billion in January, revised. Further, the release stated that:
- “February exports were $187.3 billion, $5.0 billion less than January exports.
- February imports were $258.3 billion, $1.7 billion less than January imports.

The February increase in the goods and services deficit reflected an increase in the goods deficit of $2.8 billion to $88.0 billion and a decrease in the services surplus of $0.5 billion to $16.9 billion.
Year-to-date, the goods and services deficit increased $56.5 billion, or 68.6 percent, from the same period in 2020. Exports decreased $36.2 billion or 8.7 percent. Imports increased $20.3 billion or 4.1 percent.”
Fastest Rise in Business Activity Since the Summer of 2014
On April 5th, IHS Markit ran the headline screaming: “Fastest rise in business activity since July 2014 as new order growth reaches six-year high” and then wrote:
“March PMITM data indicated a substantial increase in business activity across the U.S. service sector, and one that was the steepest for almost seven years. Contributing to the marked upturn in output was the fastest expansion in new business for six years, reflecting strengthening client demand. Firms also registered a renewed rise in new export orders. Meanwhile, rates of input cost and output charge inflation reached fresh record peaks, as firms sought to pass on steep rises in input prices to clients.

Meanwhile, sentiment among service providers about business in the year ahead improved, helping drive employment growth to a three-month high.
The seasonally adjusted final IHS Markit US Services PMI Business Activity Index registered 60.4 in March, up from 59.8 in February and above the earlier released ‘flash’ estimate of 60.0. The rate of output growth signaled was the fastest since July 2014.
Service providers often stated that the stronger expansion in business activity was due to greater client demand and the easing of virus containment restrictions in some states.
At the same time, new business increased further in March, with the rate of growth accelerating for the third successive month. The pace of the upturn in client demand was the quickest since March 2015. Firms attributed the expansion to greater spending by existing customers as well as the acquisition of new clients, often through more sales and marketing activities. Others suggested that higher confidence stemming from the vaccine roll-out had driven up customer spending.
Total sales were also supported by a renewed increase in new export orders, which rose for the second time in the past four months due to increased demand following easing lockdown restrictions in some markets.
On the price front, input costs soared in March. The rate of inflation accelerated to the fastest since data collection for the services survey began in October 2009. Anecdotal evidence widely linked the uptick in costs to higher prices for key inputs such as PPE, paper, plastics, fuel, and transportation.
Subsequently, firms sought to pass on higher costs to clients through a sharper rise in selling prices. Several companies also stated that stronger client demand allowed a greater proportion of the hike in costs to be passed through. The resulting rate of charge inflation was the quickest on record.
Meanwhile, business expectations regarding the outlook for output over the coming year improved in March. The degree of confidence was robust overall and among the strongest for six years. Optimism was commonly attributed to the ongoing vaccine roll-out and hopes of a substantial boost to new sales if social distancing measures are further eased during 2021.”


